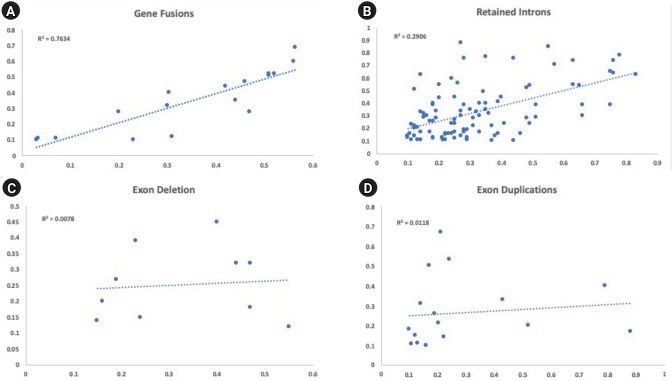
Fig. 5.
Comparison of variant allele frequencies of structural variants between primary bone marrow samples (x-axis) and matched xenograft sample (y-axis). (A) The variant allele frequencies for all gene fusions were plotted between the primary and xenograft model (R2 = 0.7634). (B) The variant allele frequencies for all retained introns were plotted between the primary and xenograft model (R2 = 0.2906). (C) The variant allele frequencies for all exon deletion were plotted between the primary and xenograft model (R2 = 0.0078). (D) The variant allele frequencies for all exon duplications were plotted between the primary and xenograft model (R2 = 0.0118).

