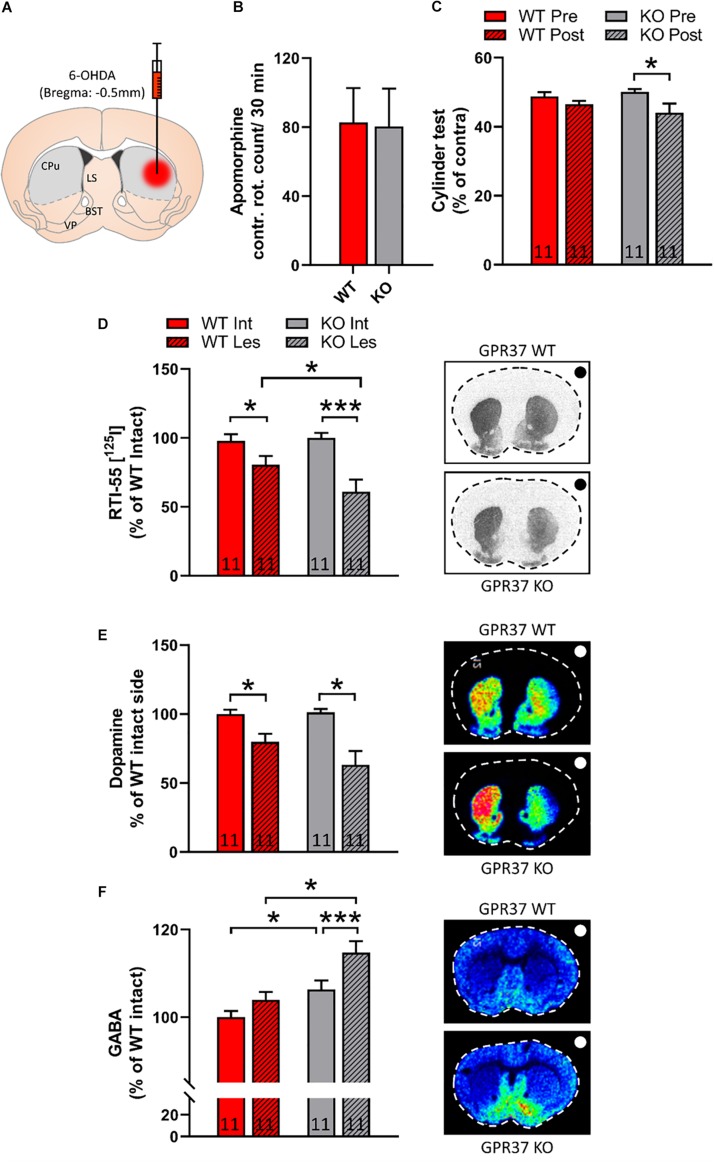
FIGURE 3.
GPR37 KO show altered cylinder test score and striatal GABA after intrastriatal 6-OHDA lesion. (A) Schematic representation of intrastriatal 6-OHDA administration at bregma: + 0.5 mm. With gray it is depicted the region that was used for quantification. CPu, caudoputamen; LS, lateral septum; BST, bed nucleus of stria terminalis; VP, ventral pallidum. (B) Bar graph showing the contralateral rotation count after acute administration of apomorphine. (C) Bar graph showing the cylinder test score in WT and GPR37 KO mice, prior and after the 6-OHDA lesion. (D) Quantification of autoradiographic of specific striatal dopamine transporter binding with [125I] RTI-55. (E,F) Bar graphs showing the quantification of MALDI signal from dopamine (DA) (E) and GABA (F) in WT and GPR37 KO after the intrastriatal 6-OHDA lesion. The black/white dot on the right side of each picture indicates the side of the lesion. The n for each group is denoted in the corresponding bar. Data are expressed as mean ± SEM. *p < 0.05, **p < 0.01, and ***p < 0.001, Fisher’s LSD post hoc test.

