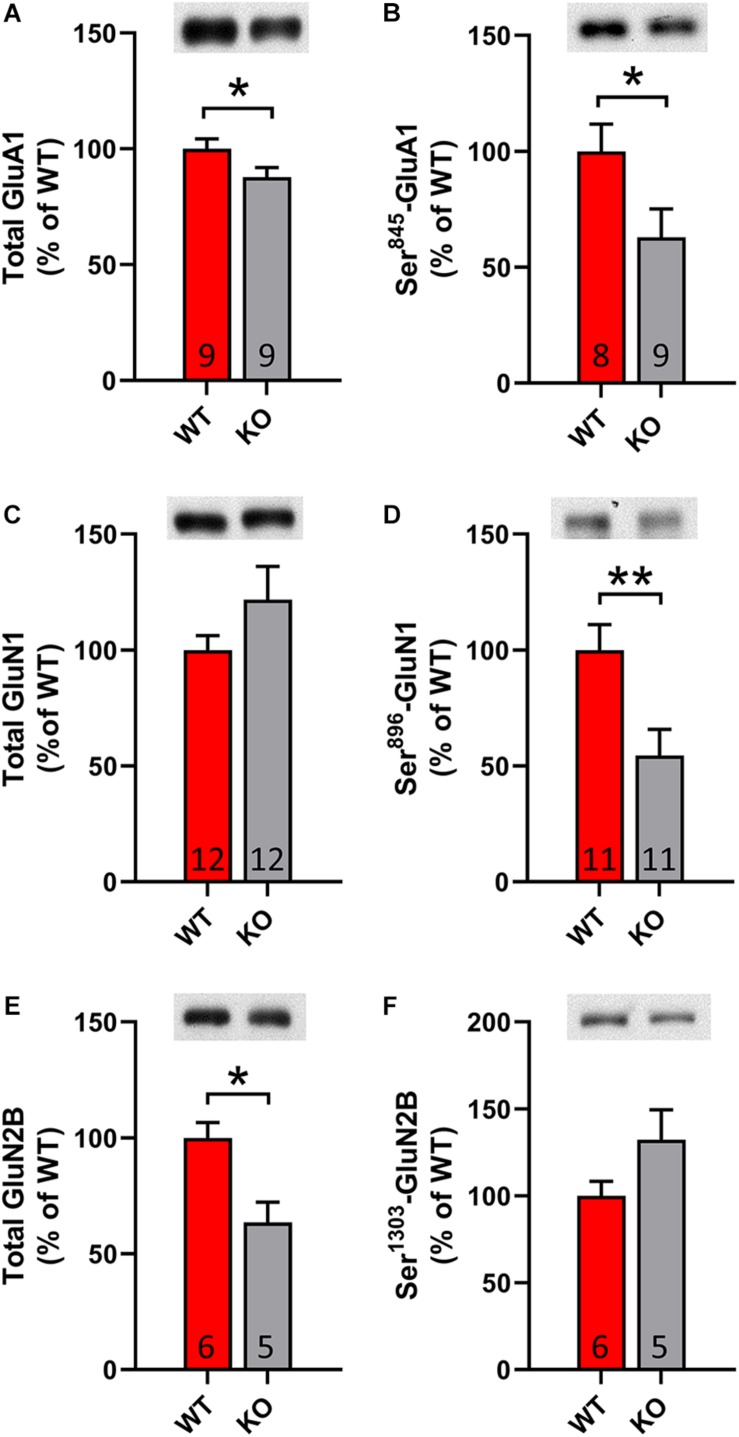
FIGURE 5.
GPR37 KO show altered striatal glutamate receptor subunit content. (A–F) Bar graphs showing the total or phosphorylated protein level for AMPA receptor subunit (A,B) and NMDA receptor subunits (C–F) in WT and GPR37 KO striata. The n for each group is denoted in the corresponding bar. Data are expressed as mean ± SEM. *p < 0.05, **p < 0.01, Student’s t-test or Mann-Whitney test.

