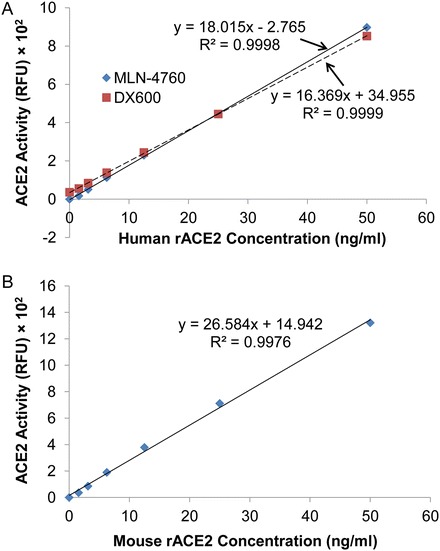
Fig. 1.

Standard curves for ACE2 activity assay. The assay was performed for 16 h incubation. Graph shows the concentrations of recombinant ACE2 (rACE2) versus the ACE2 activity (RFU). (a) Standard curves generated for human rACE2. The ACE2 inhibitors MLN-4760 (10−6 M) or DX600 (10−6 M) were used. The relationship is highly linear for rACE2 concentrations between 0 and 50 ng/ml (R 2 = 0.9998, p < 0.001 for MLN-4760, R 2 = 0.9999, p < 0.001 for DX600). (b) Standard curve generated for mouse rACE2. The ACE2 inhibitor MLN-4760 (10−6 M) was used. A highly linear relationship exists for rACE2 concentrations between 0 and 50 ng/ml (R 2 = 0.9976, p < 0.001)
