
Fig. 4.
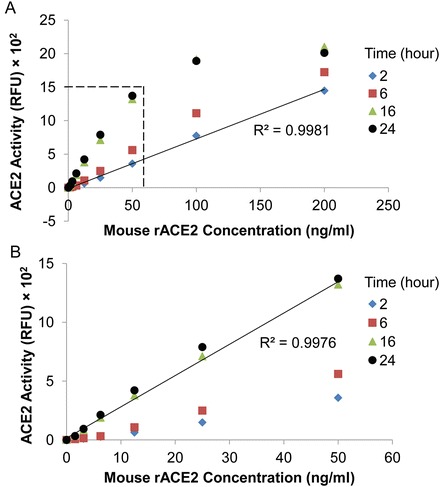
Time course of ACE2 activity assay. ACE2 activity was measured for 2, 6, 16, and 24 h incubation, with mouse rACE2 concentrations ranging from 0 to 200 ng/ml. Graph depicts the concentrations of mouse rACE2 versus the ACE2 activity (RFU) at different time points. (a) Standard curve generated for mouse rACE2 for 2 h incubation. A highly linear relationship exists for rACE2 concentrations from 0 to 200 ng/ml (R 2 = 0.9981, p < 0.001). The area marked with dashed lines is shown in b. (b) Standard curve generated for mouse rACE2 for 16 h incubation. The relationship is highly linear for rACE2 concentrations between 0 and 50 ng/ml