Fig. 5.

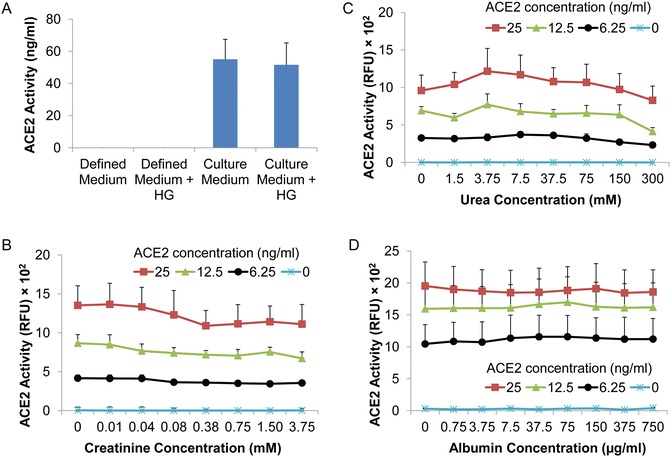
Effect of potential modulators on ACE2 activity assay. The assay was performed for 16 h incubation. (a) Graph shows ACE2 activity in defined medium (not incubated with mouse PT cells), and culture medium collected from primary cultures of mouse PT cells after 72 h incubation, in the presence of normal (7.8 mM) or high concentrations of d-glucose (HG, 25 mM). No ACE2 activity is detected in the defined medium. Results are means ± SEM; p > 0.05, culture medium vs culture medium + HG; n = 3. (b) Graph depicts the effect of addition of various concentrations of creatinine on ACE2 activity (RFU) at different mouse rACE2 concentrations. Results are means ± SEM; p > 0.05 for all graphs; n = 3. (c) Graph depicts the effect of addition of various concentrations of urea on ACE2 activity (RFU) at different mouse rACE2 concentrations. Results are means ± SEM; p > 0.05 for all graphs; n = 3. (d) Graph depicts the effect of addition of exogenous albumin on ACE2 activity (RFU) at different mouse rACE2 concentrations. Albumin at the indicated concentrations was added to urine samples (1 μl) from mice with gene deletion of ACE2. Results are means ± SEM; p > 0.05 for all graphs; n = 3
