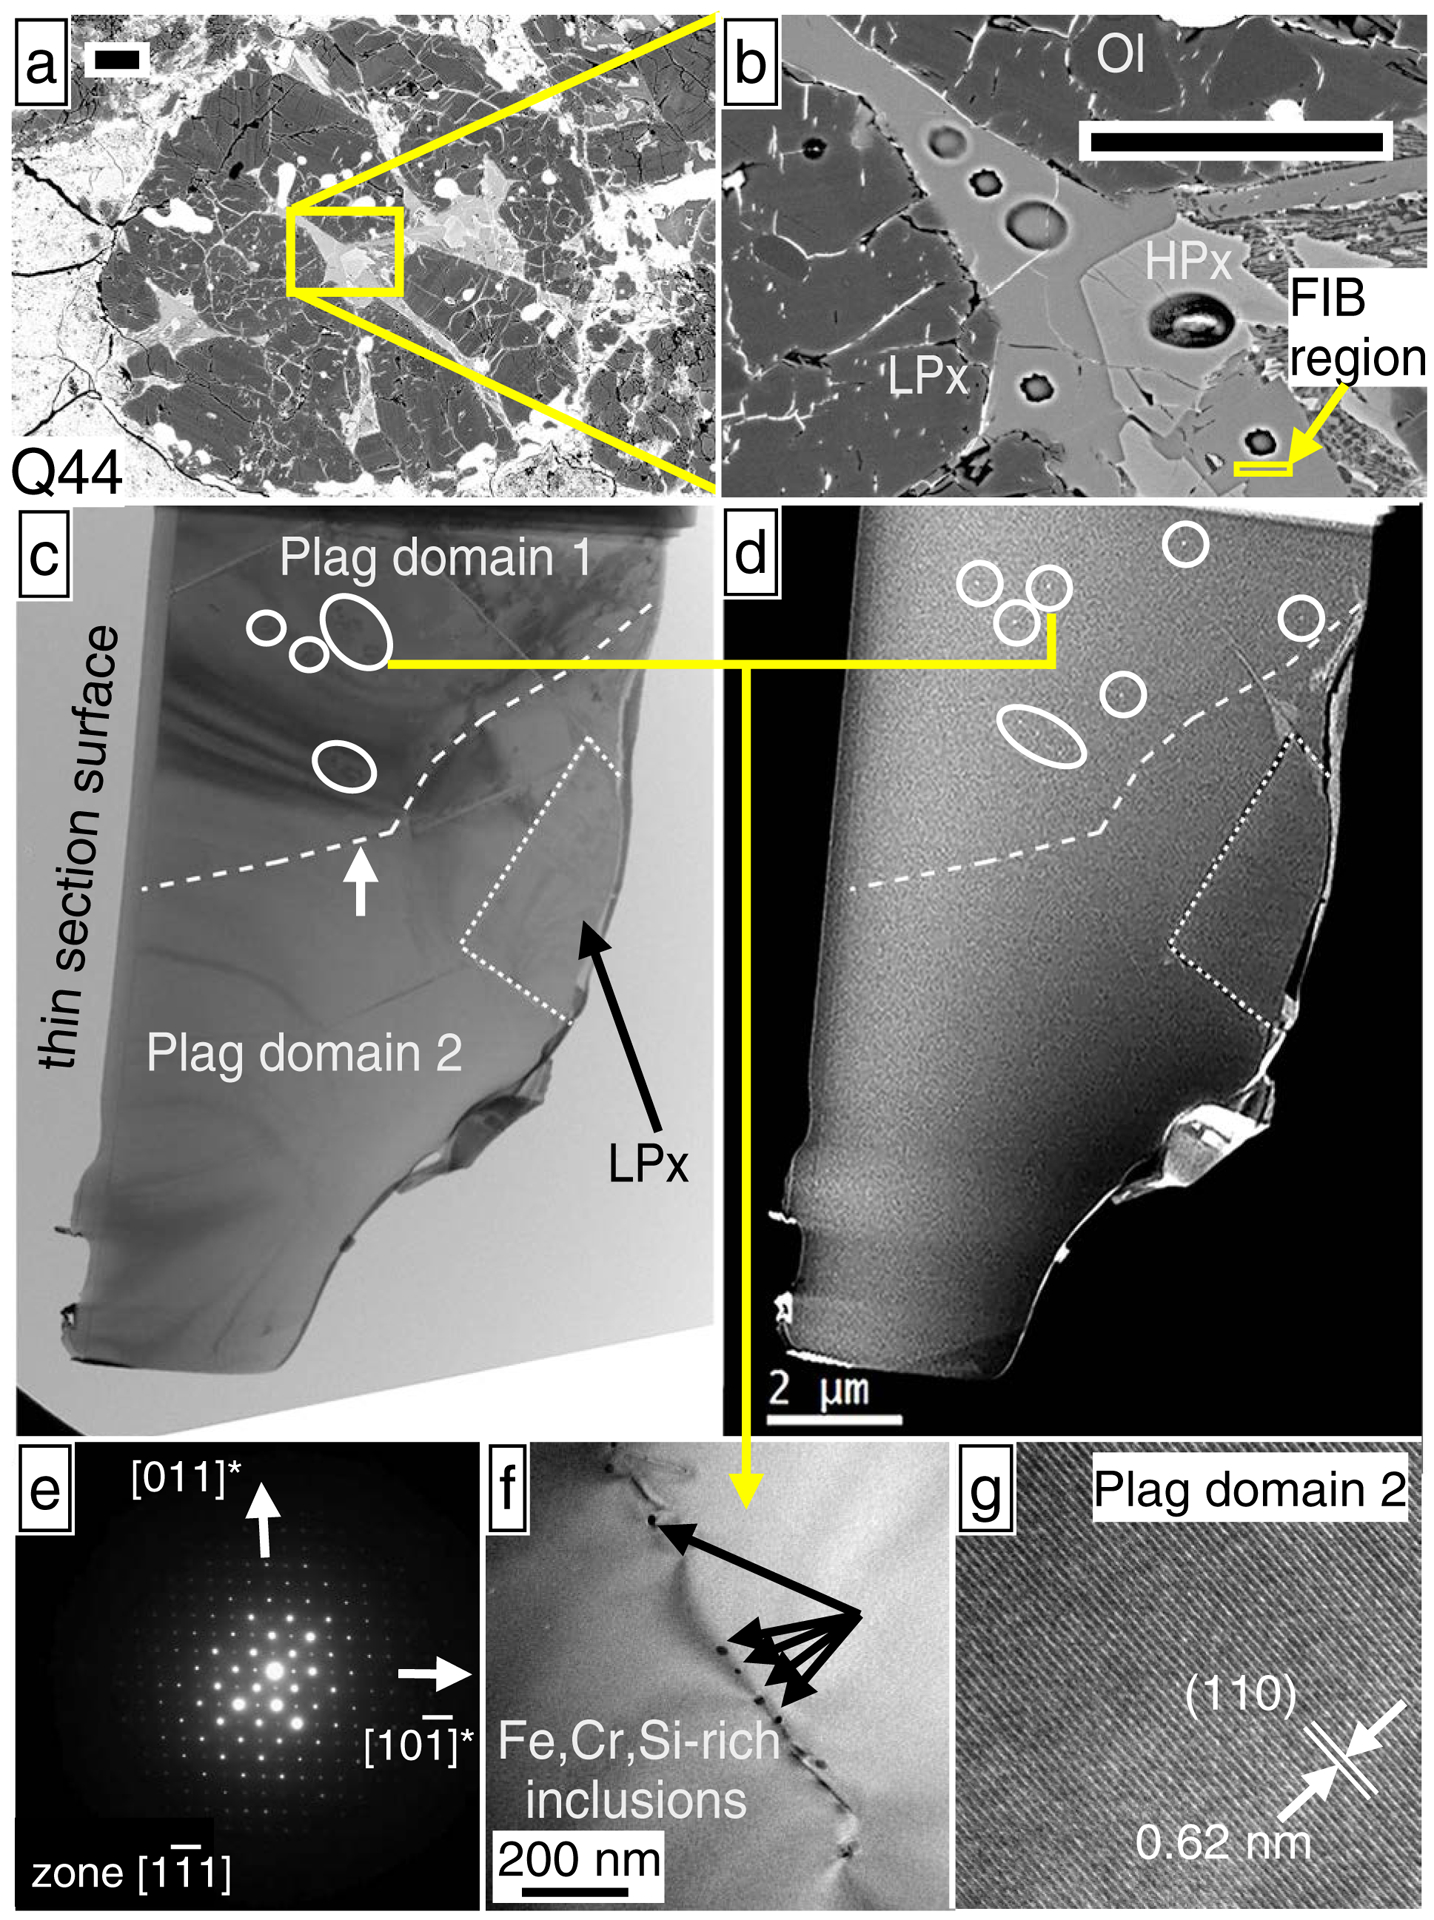
Fig. 7.

Electron micrographs of plagioclase from chondrule Q44, which has no resolvable excess 26Mg (Table 2; Fig. 4). (a) and (b) SEM images of plagioclase sectioned by FIB, where scale bars are 50 μm. SIMS pits from plagioclase Al-Mg isotope analyses, as well as a high-Ca pyroxene O-isotope analysis, are visible in (b). (c) thin-foil TEM image of the plagioclase section, consisting of a plagioclase grain and a low-Ca pyroxene grain, separated by a dotted line. The plagioclase is divided into two domains (dashed line; white arrow) by a subgrain boundary consisting of dislocation arrays. Color bands in the image correspond to thickness fringes. The thin gray layer running parallel to the thin section surface is a carbon deposit. Circled regions correspond to free dislocations. (d) HAADF-STEM Z-contrast image. Circled regions depict sub-micron-sized inclusions appearing as tiny bright dots. With the exception of these inclusions, the plagioclase is chemically homogeneous (elemental EDS maps are provided in Electronic Appendix EA6). (e) SAED pattern of plagioclase, showing a diffraction pattern consistent with only an unmodified anorthite structure and showing no superlattice reflections. (f) Bright-field TEM image of a dislocation region in plagioclase domain 1 and associated Fe,Cr,Si-rich inclusions as determined by EDS. (g) HRTEM image of a region analyzed in plagioclase domain 2, which does not have dislocations or inclusions down to the nm-scale.
