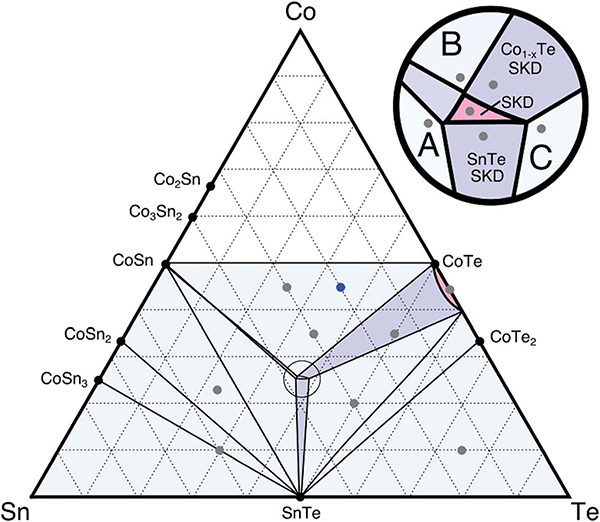
Fig. 3.
A proposed Co–Sn–Te ternary phase diagram at 600 °C was generated experimentally using diffraction data (gray and blue points). The blue point was analyzed via synchrotron XRD (ES5†). One-, two-, and three-phase regions are pink, purple, and blue, respectively. Inset shows phases surrounding the ternary Co–Sn–Te skutterudite, which are the focus of our phase boundary mapping study. We omit Co-rich samples due to lack of phase equilibria with skutterudite.

