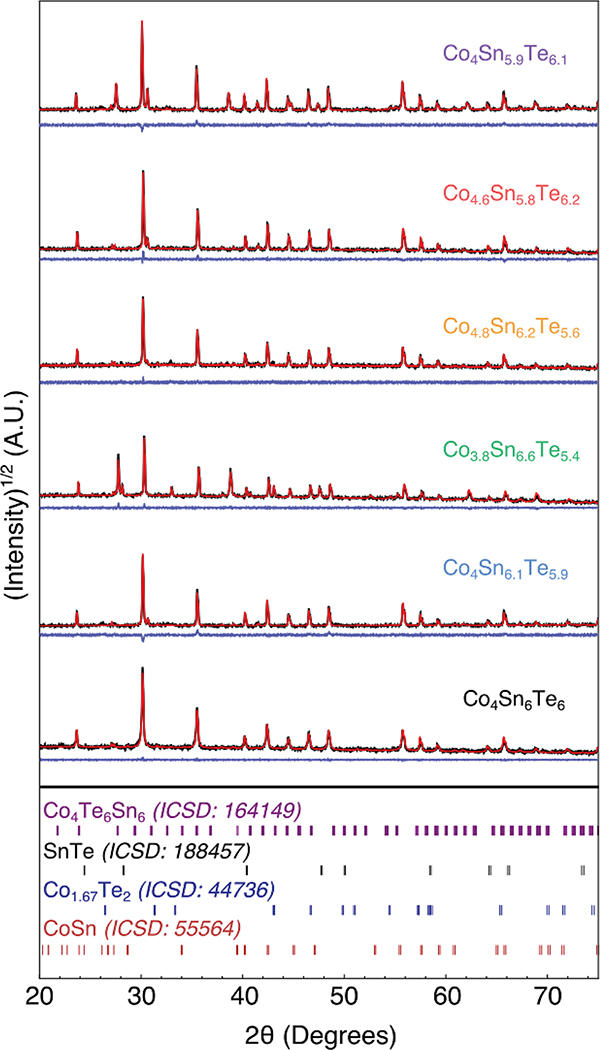
Fig. 4.
TOPAS refined X-ray diffraction data for samples seen in the Fig. 3 inset. Nominal compositions have been colored to correspond to their transport data below. ICSD reference patterns are provided as stick plots. Experimental data, TOPAS fit and the difference profiles are shown (black, red, and blue respectively). Refinement values can be found in the ESI (ES6†). Intensity has been plotted on a square root scale to intensify the secondary peaks.

