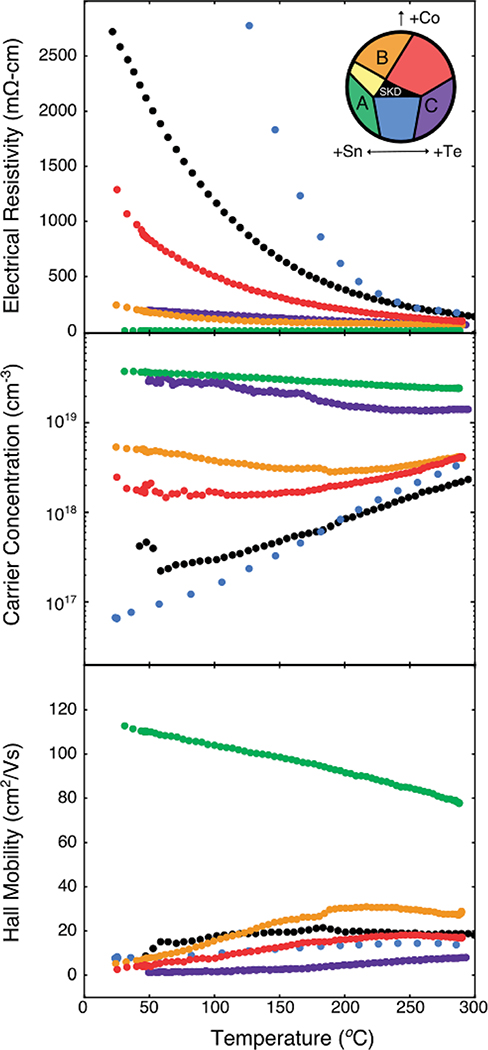
Fig. 5.
Resistivity, carrier concentration, and mobility data versus temperature. Transport data are color-coded with the regions observed in the inset in the resistivity plot. Note that this is the same compositional space as that observed in the inset of Fig. 3.

