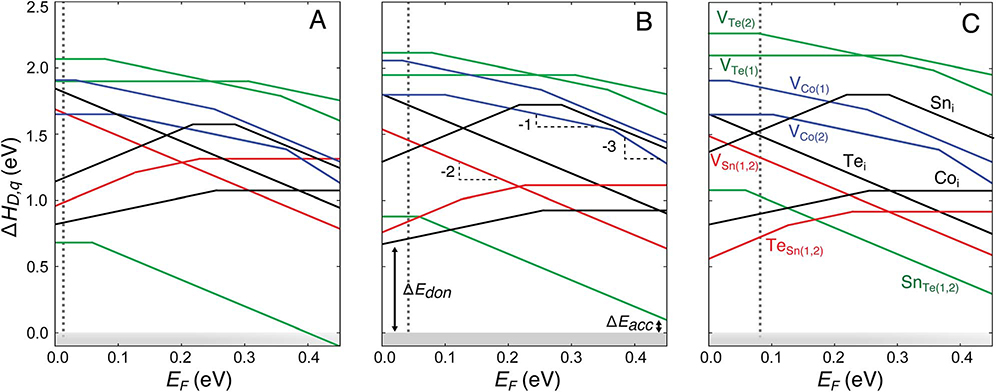
Fig. 8.
Defect formation energy (ΔHD,q) as a function of the Fermi energy (EF) for Co4Sn6Te6 under growth conditions corresponding to the chemical potentials at points A, B, and C shown in Fig. 7(c) (A, B, and C, respectively). EF is referenced to the valence band maximum and ranges from 0 eV to the calculated band gap (0.45 eV). The dominant defects include antisites TeSn and SnTe and Co interstitials. The subscripts (1) and (2) refer to different Wyckoff positions. The dopability window for donors (ΔEdon) and acceptors (ΔEacc) is marked for growth conditions corresponding to the point B. Vertical dotted lines represent the equilibrium Fermi energy established by charge neutrality at T = 873 K.

