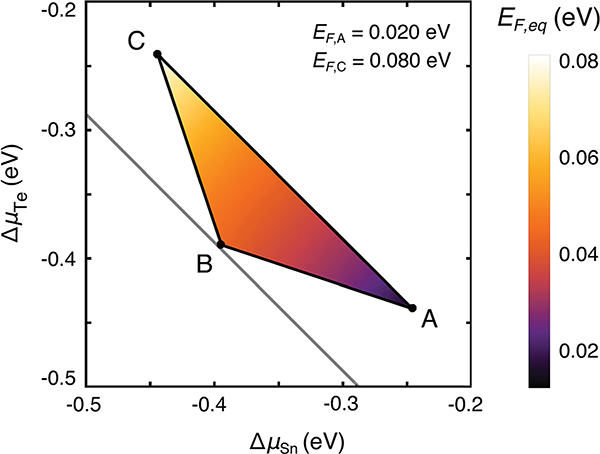
Fig. 9.
Equilibrium Fermi energy (EF,eq) in the phase stability region of Co4Sn6Te6, which is shown as a projection along the ΔμCo axis (projection direction indicated by an arrow in Fig. 7(b)). EF,eq is referenced to the valence band maximum. Points A, B, and C are the three-phase points shown in Fig. 7(c). The equilibrium EF lies below the midgap; Co4Sn6Te6 ranges between natively p-type and n-type doped in the singe-phase region and the three-phase points.

