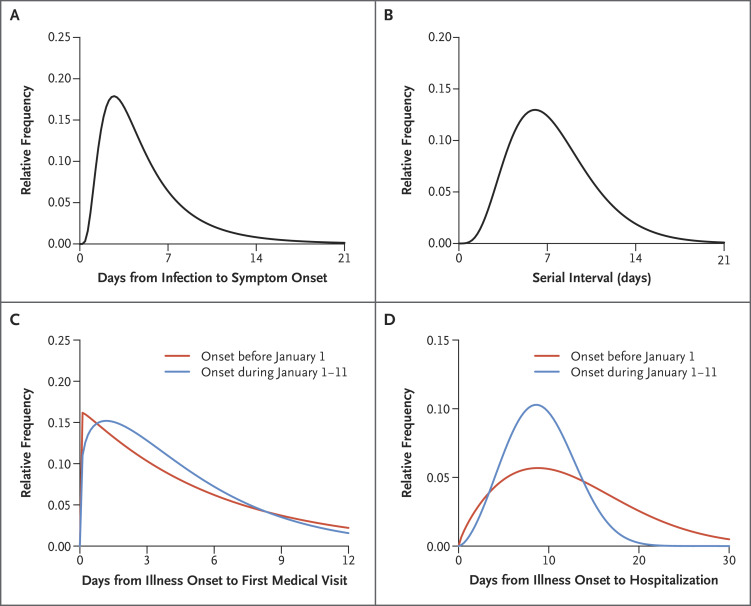
Figure 2. Key Time-to-Event Distributions.
The estimated incubation period distribution (i.e., the time from infection to illness onset) is shown in Panel A. The estimated serial interval distribution (i.e., the time from illness onset in successive cases in a transmission chain) is shown in Panel B. The estimated distributions of times from illness onset to first medical visit are shown in Panel C. The estimated distributions of times from illness onset to hospital admission are shown in Panel D.

