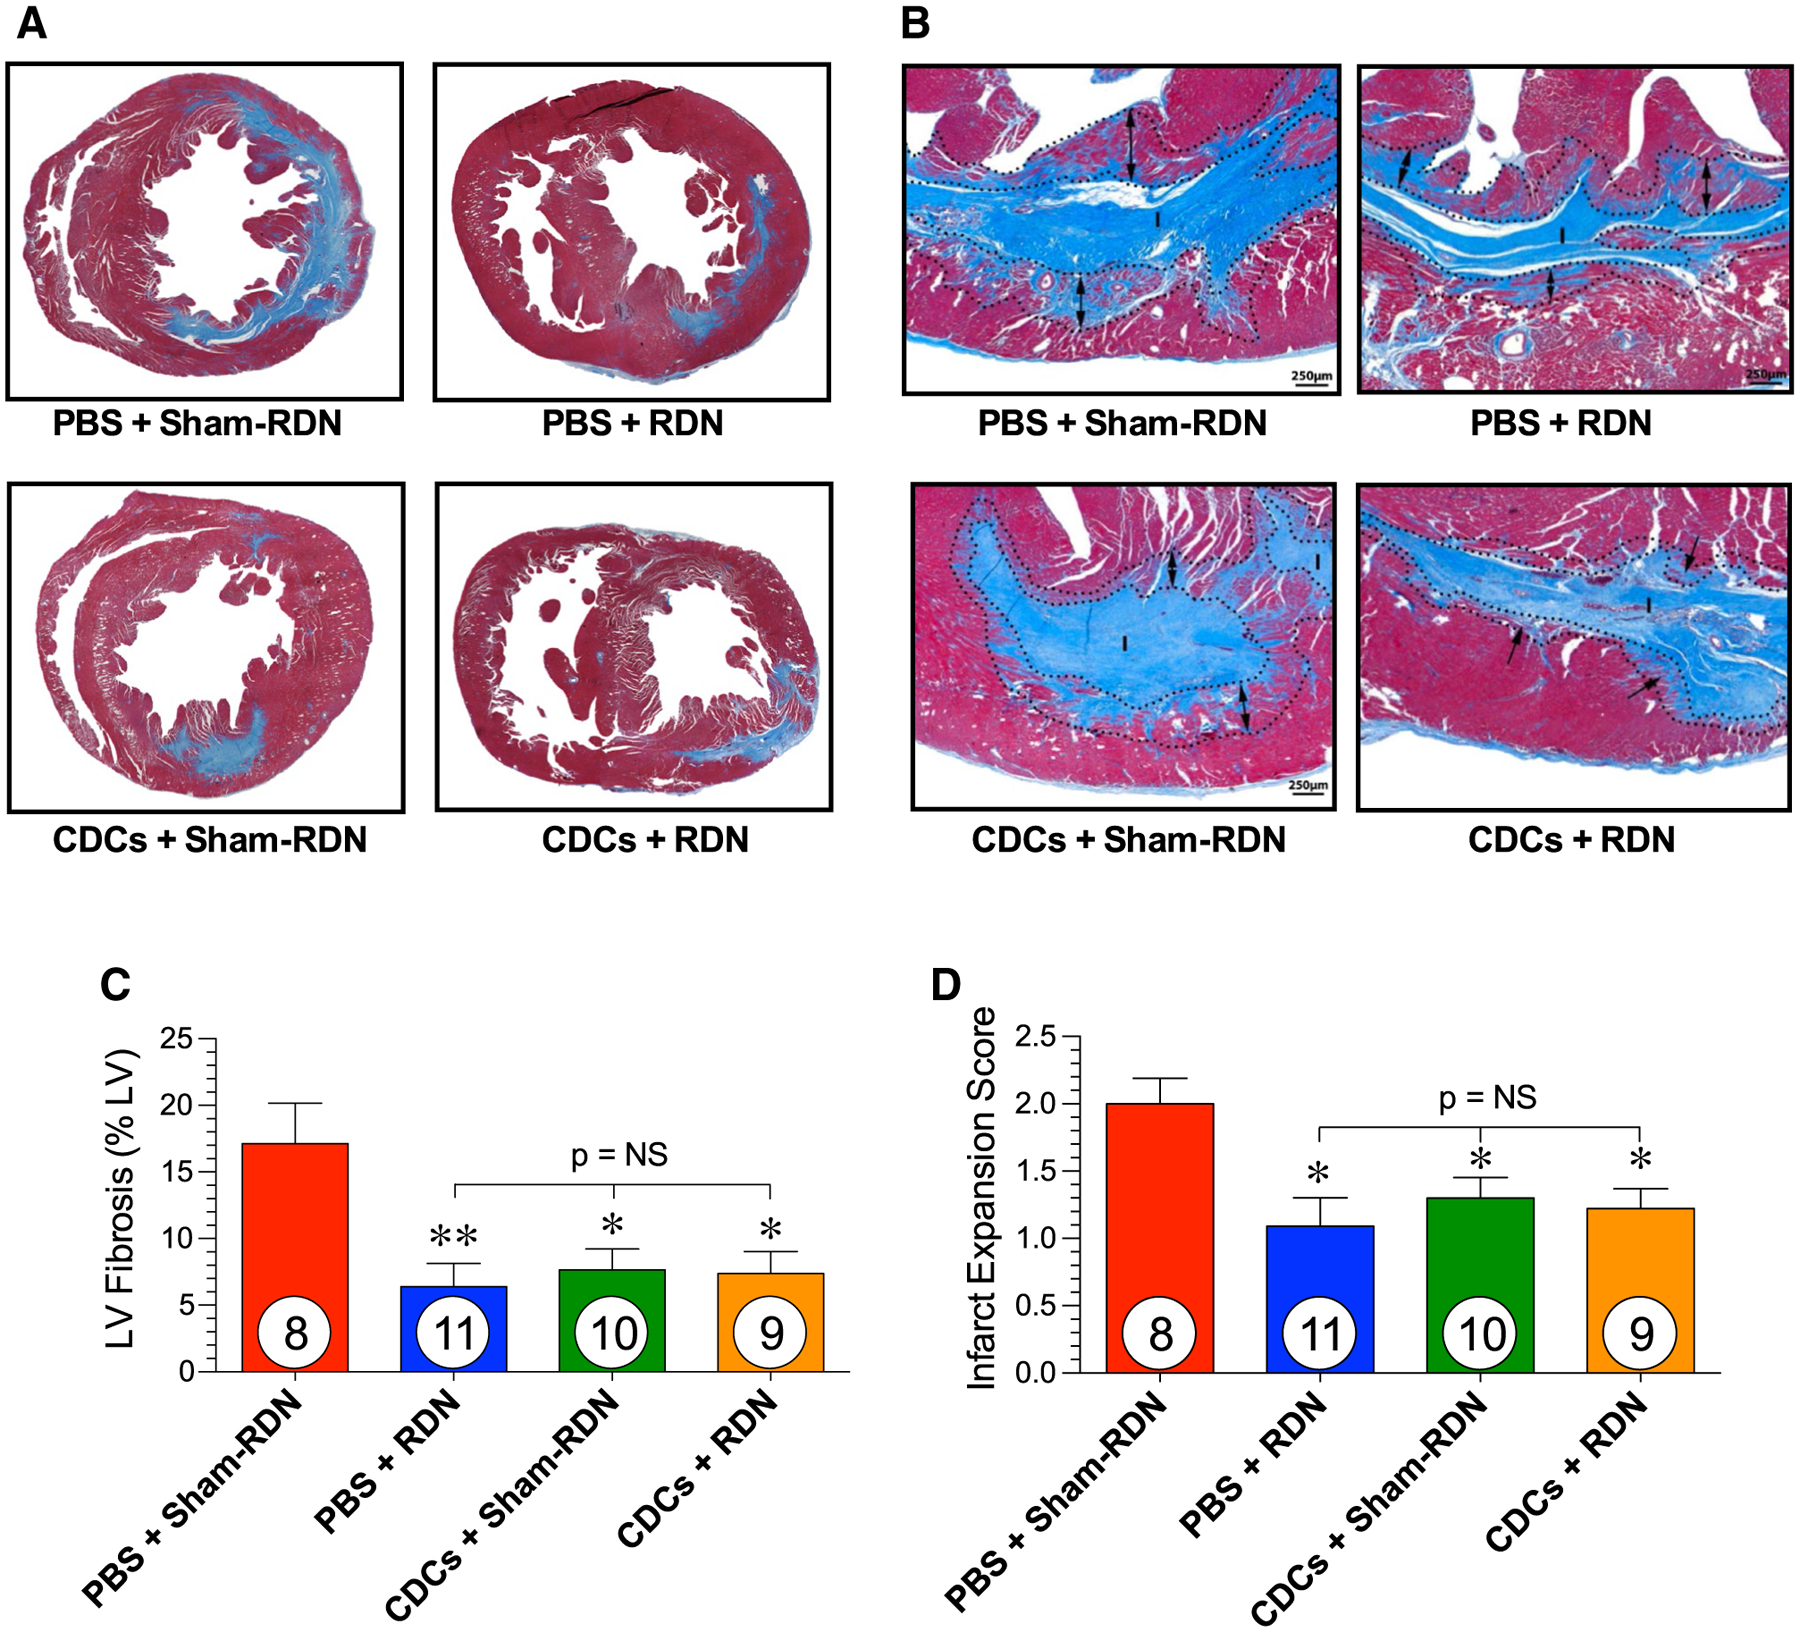
Fig. 8.

Cardiac fibrosis following ischemic injury in WKY rats. Representative images in LV stained with Masson’s trichrome of the a mid-ventricular short axis and b the solid fibrous infarct (I) and the infarct expansion zone (dotted lines with arrows) at 14 weeks following myocardial infarction in animals treated with PBS + Sham-RDN, PBS + RDN, CDCs + Sham-RDN, and CDCs + RDN. c Total LV fibrosis relative to the LV and d infarct expansion score. Mean is represented as ± SEM. *p < 0.05, **p < 0.01 compared to PBS
