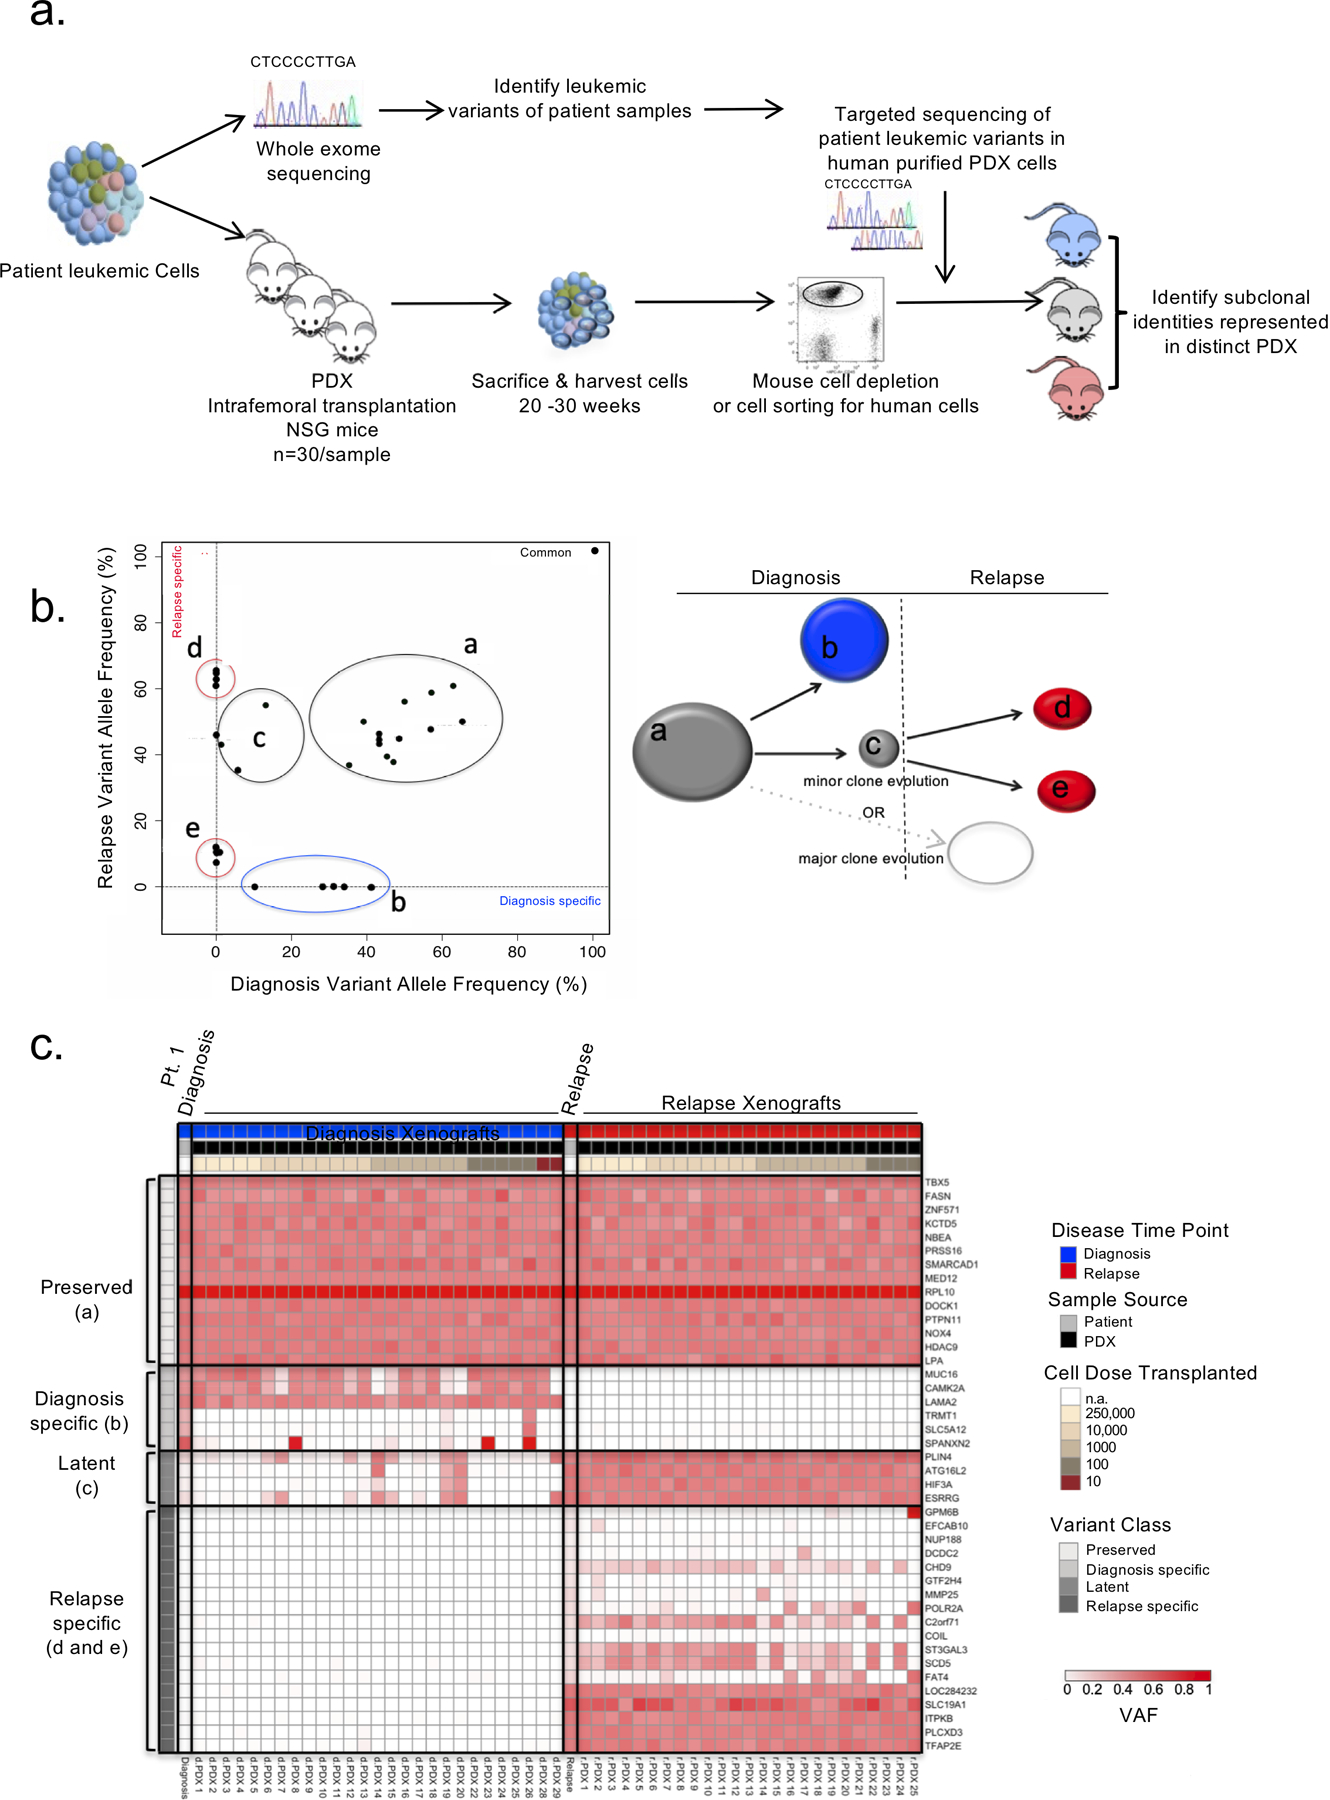
Figure 1: PDXs capture clonal diversity present in paired diagnosis and relapse B-ALL samples.

a. Experimental schematic. PDXs were generated for 6 adult and 8 pediatric B-ALL patient samples at diagnosis and relapse by intrafemoral transplantation of sorted leukemic blasts into 30 irradiated NSG mice in a limiting dilution assay. Mice were sacrificed 20–30 weeks post transplant and their engraftment was assessed by flow cytometry. Patient samples were also subjected to genomic analysis including whole exome sequencing (WES). Variants identified from the WES of patient samples at either time point were used to create custom capture baits for targeted sequencing at a deeper depth in the patient samples and their corresponding PDX. PDXs representing varying clones were identified. b. Schematic representation of the results obtanined by mutational clustering of variants based on the variant allele frequencies (VAF) at diagnosis (x-axis) and relapse (y-axis) of patient 1 in 2D VAF plots showing evolution from a minor subclone as depicted. Each dot represents a variant. Shared variants are shown in grey clusters (clusters a and c). Diagnosis and relapse specific variants are shown in the blue cluster (cluster b) and red clusters (clusters d and e) respectively. c. Heatmap of the variant allele frequencies of leukemic variants at diagnosis, relapse and in their corresponding PDXs for patient 1. Variant classes are labeled with their class and a letter corresponding to the clusters illustrated in b.
