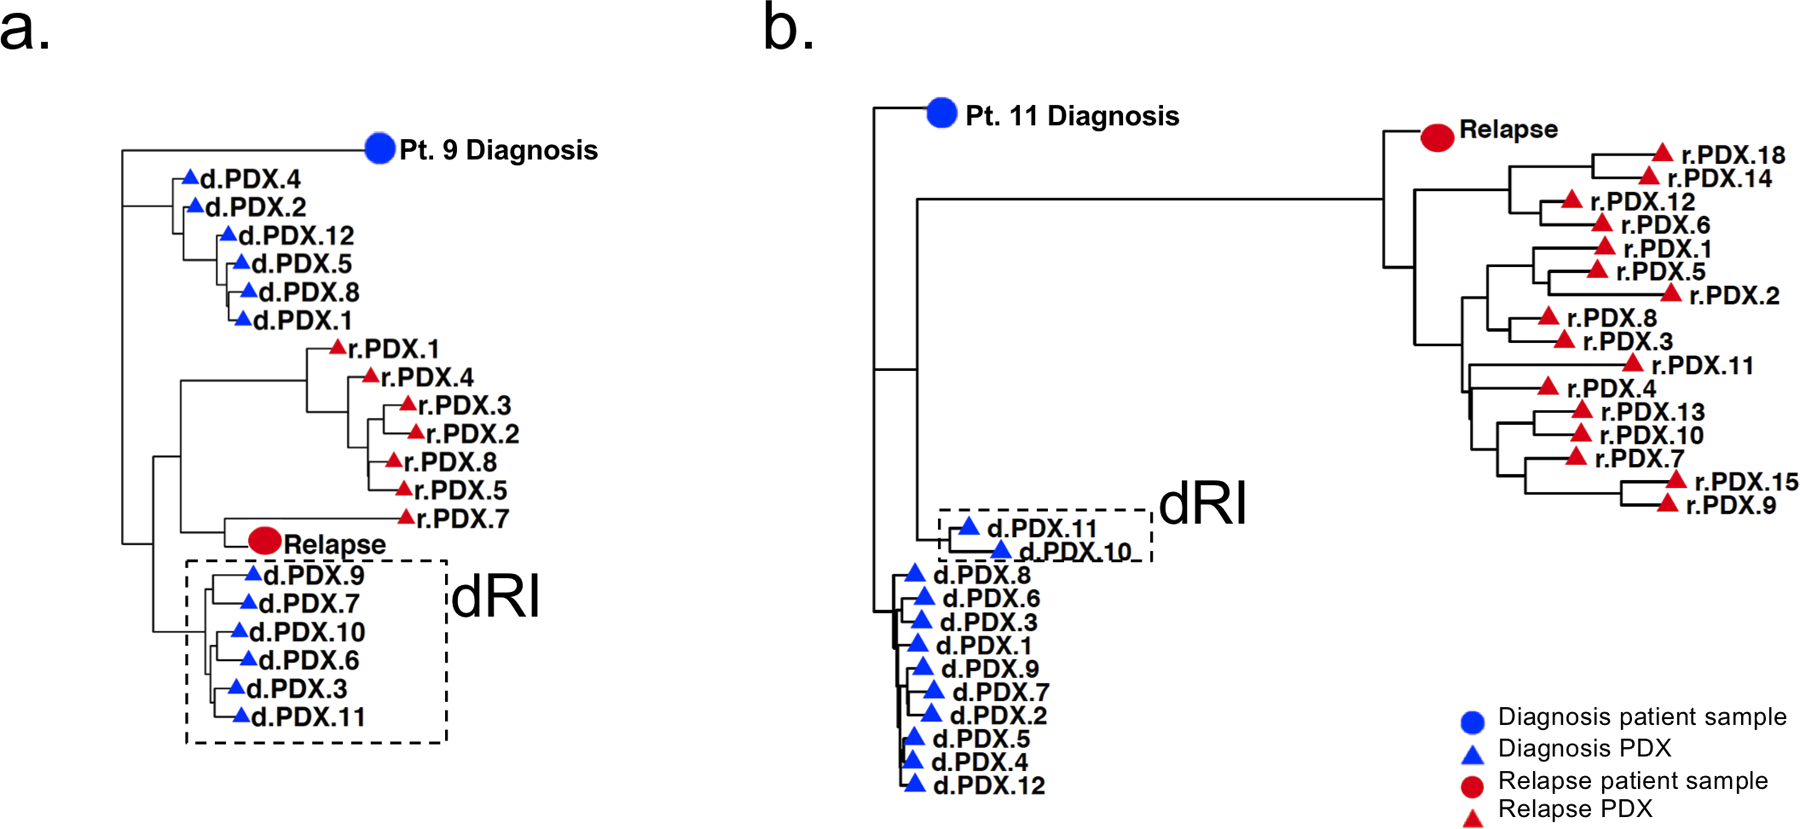
Figure 3: PDXs identify relapse-fated clones in diagnosis patient samples.

a. and b. Phylogenetic analysis showing relationship of patient 9 (a) and patient 11 (b) patient samples and xenografts, based on VAF of leukemic variants. The distance between symbols on the tree were estimated by a nearest neighbour joining method and represent the degrees of relation between them (Minkowski’s distance). Circles represent patient samples and triangles represent PDX; blue represents diagnosis and red represents relapse. Diagnosis clones on the trajectory to relapse were termed diagnosis relapse initiating clones or dRI and are indicated by a box with a hatched border.
