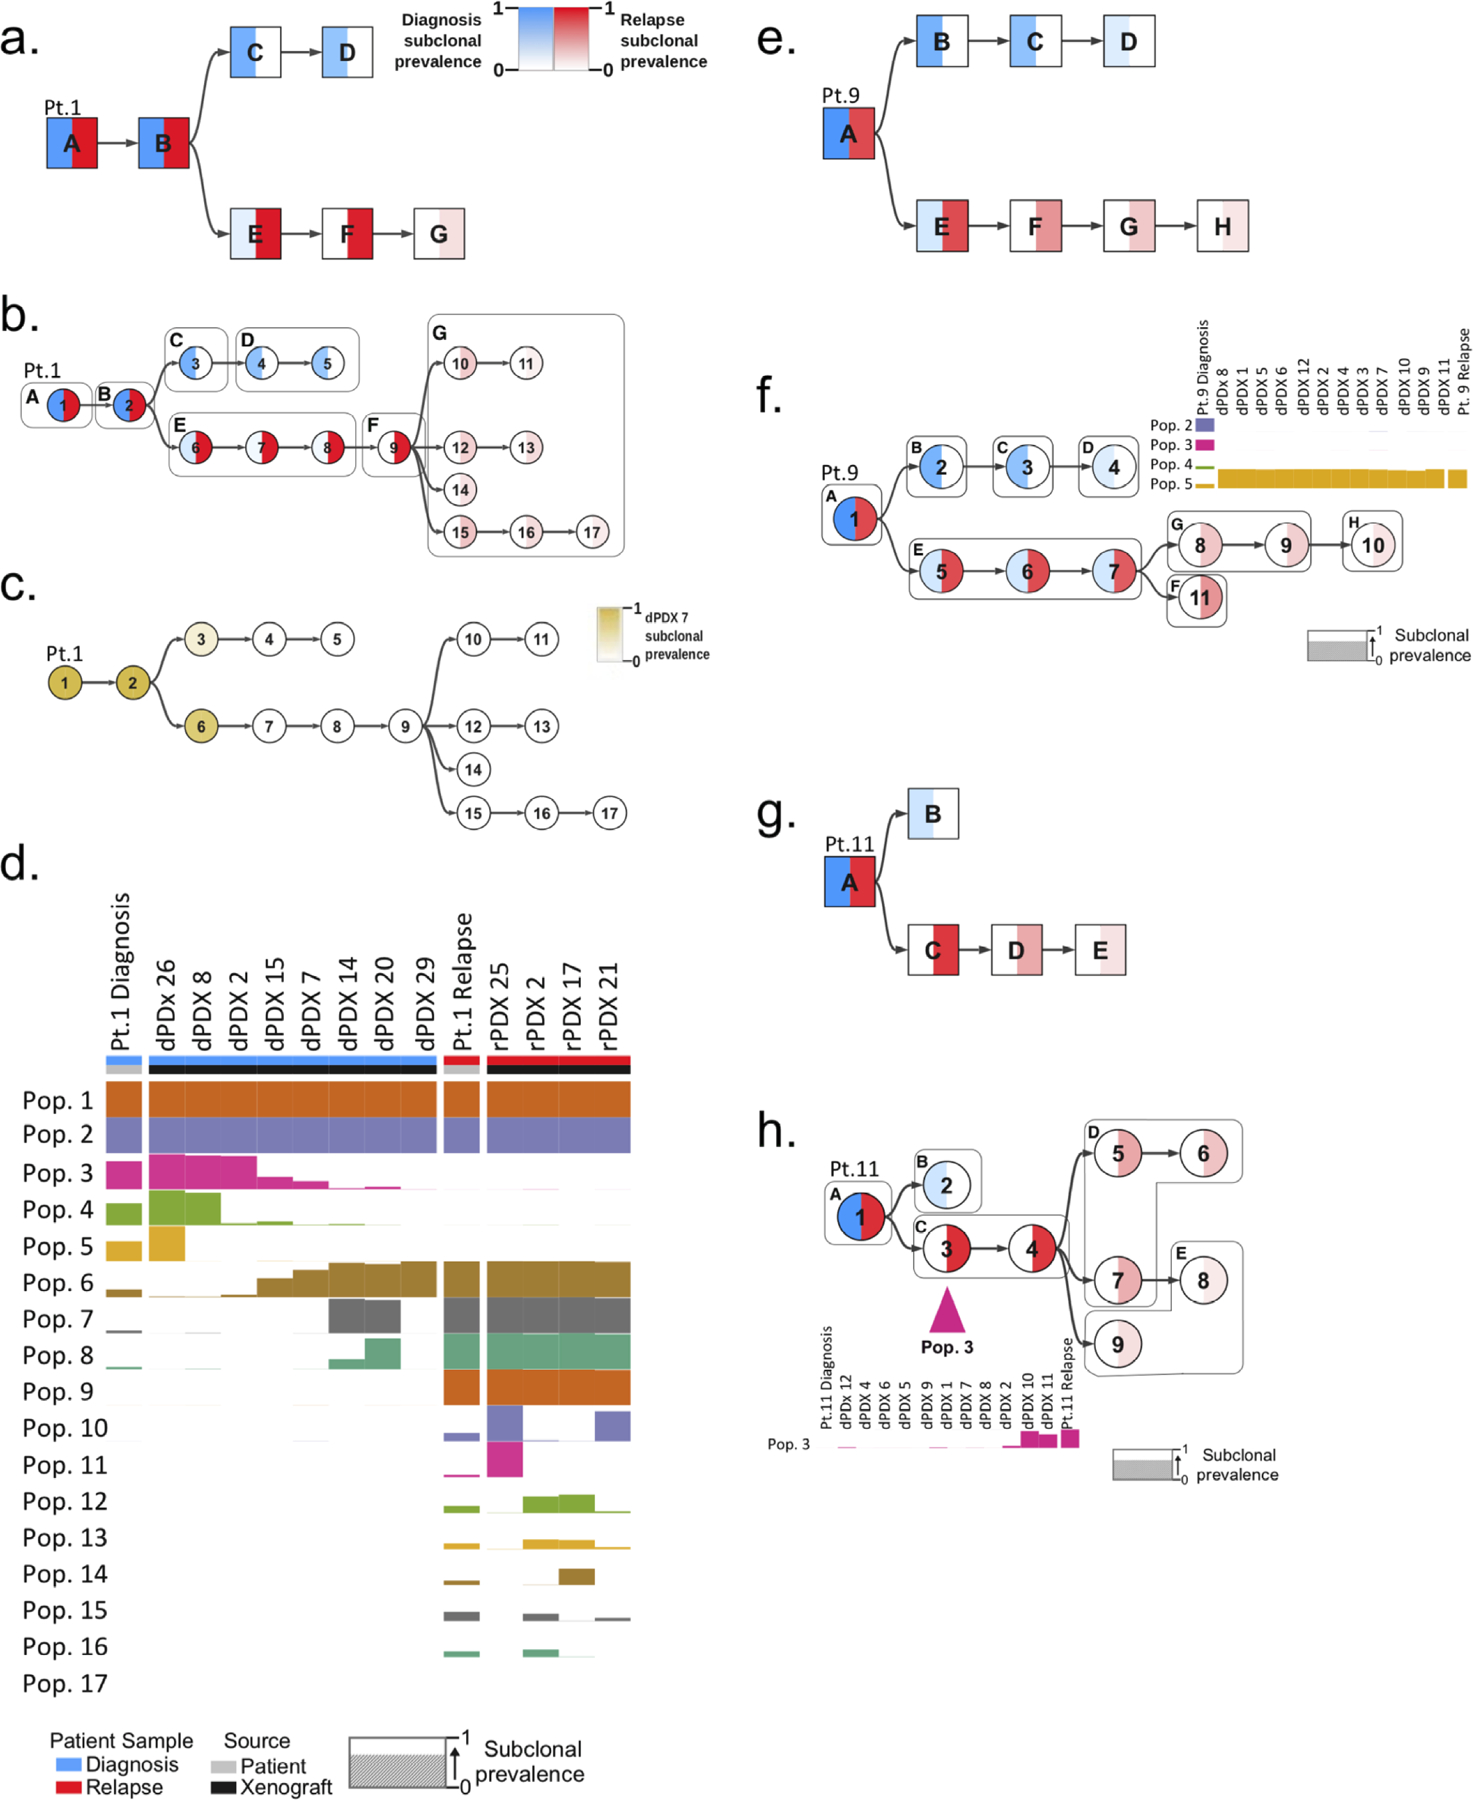
Figure 4: Generation of mutational trees from the combined genomic data of xenografts and bulk diagnosis and relapse patient samples.

Mutational trees of variants clustered to form populations using the PairTree algorithm. Nodes in mutational trees are divided in half, with the intensity of blue in the left half indicating the frequency of the population’s variants at diagnosis, and the intensity of red in the right half showing the frequency of the population’s variants at relapse. Colour intensity shows subclonal prevalence as noted in the legend of a. and applicable to all other trees except c. a. Mutational tree of patient 1 derived by analysis of the patient samples (diagnosis and relapse) alone. Mutational populations identified from bulk patient samples alone are denoted by a square node labeled with with an alphabetical letter. b. Combined mutational tree derived from the variant analysis of both patient 1 patient samples and all their generated xenografts. Mutational populations derived from combined patient and xenograft analysis are represented by cicrcular nodes labeled with numerals. The mutational populations identified using the patient samples alone in a., are overlaid on the tree as boxes labeled with their corresponding alphabetical letter. This identifies instances where single populations in a correspond to multiple populations when xenografts are included (ie. mutational population G). c. Combined mutational tree of patient 1 shaded to indicate the prevalence of variants in dPDX 7 (instead of diagnosis and relapse) demonstrating that this PDX is composed primarily of variants of the relapse lineage. d. Presence of identified mutational populations in patient samples and representative xenografts. Mutational populations (Pop.) are displayed on the y-axis and individual patient samples or xenografts are displayed on the x-axis. The height of the population bar represents the prevalence of the lineage in the patient sample (Pt.) or xenograft. e. Mutational tree, similar to a, derived from patient samples alone of patient 9. f. Combined mutational tree, similar to b, derived jointly from patient 9 patient samples and xenografts. Subclonal prevalences of populations 2–5 are shown, indicating the absence of diagnosis populations 2–4 and presence of population 5 (the first node in the relapse lineage branch) in all dPDX. g. Mutational tree, similar to a, of patient 11 derived from patient samples alone. h. Combined mutational tree, similar to b, of patient 11 derived from patient samples and xenografts. The prevalence of mutational population 3 is displayed, highlighting its absence in the diagnosis patient and its detection in only two dPDX.
