
Figure 5: Competitive dRI-PDX clones identified in diagnosis PDX.
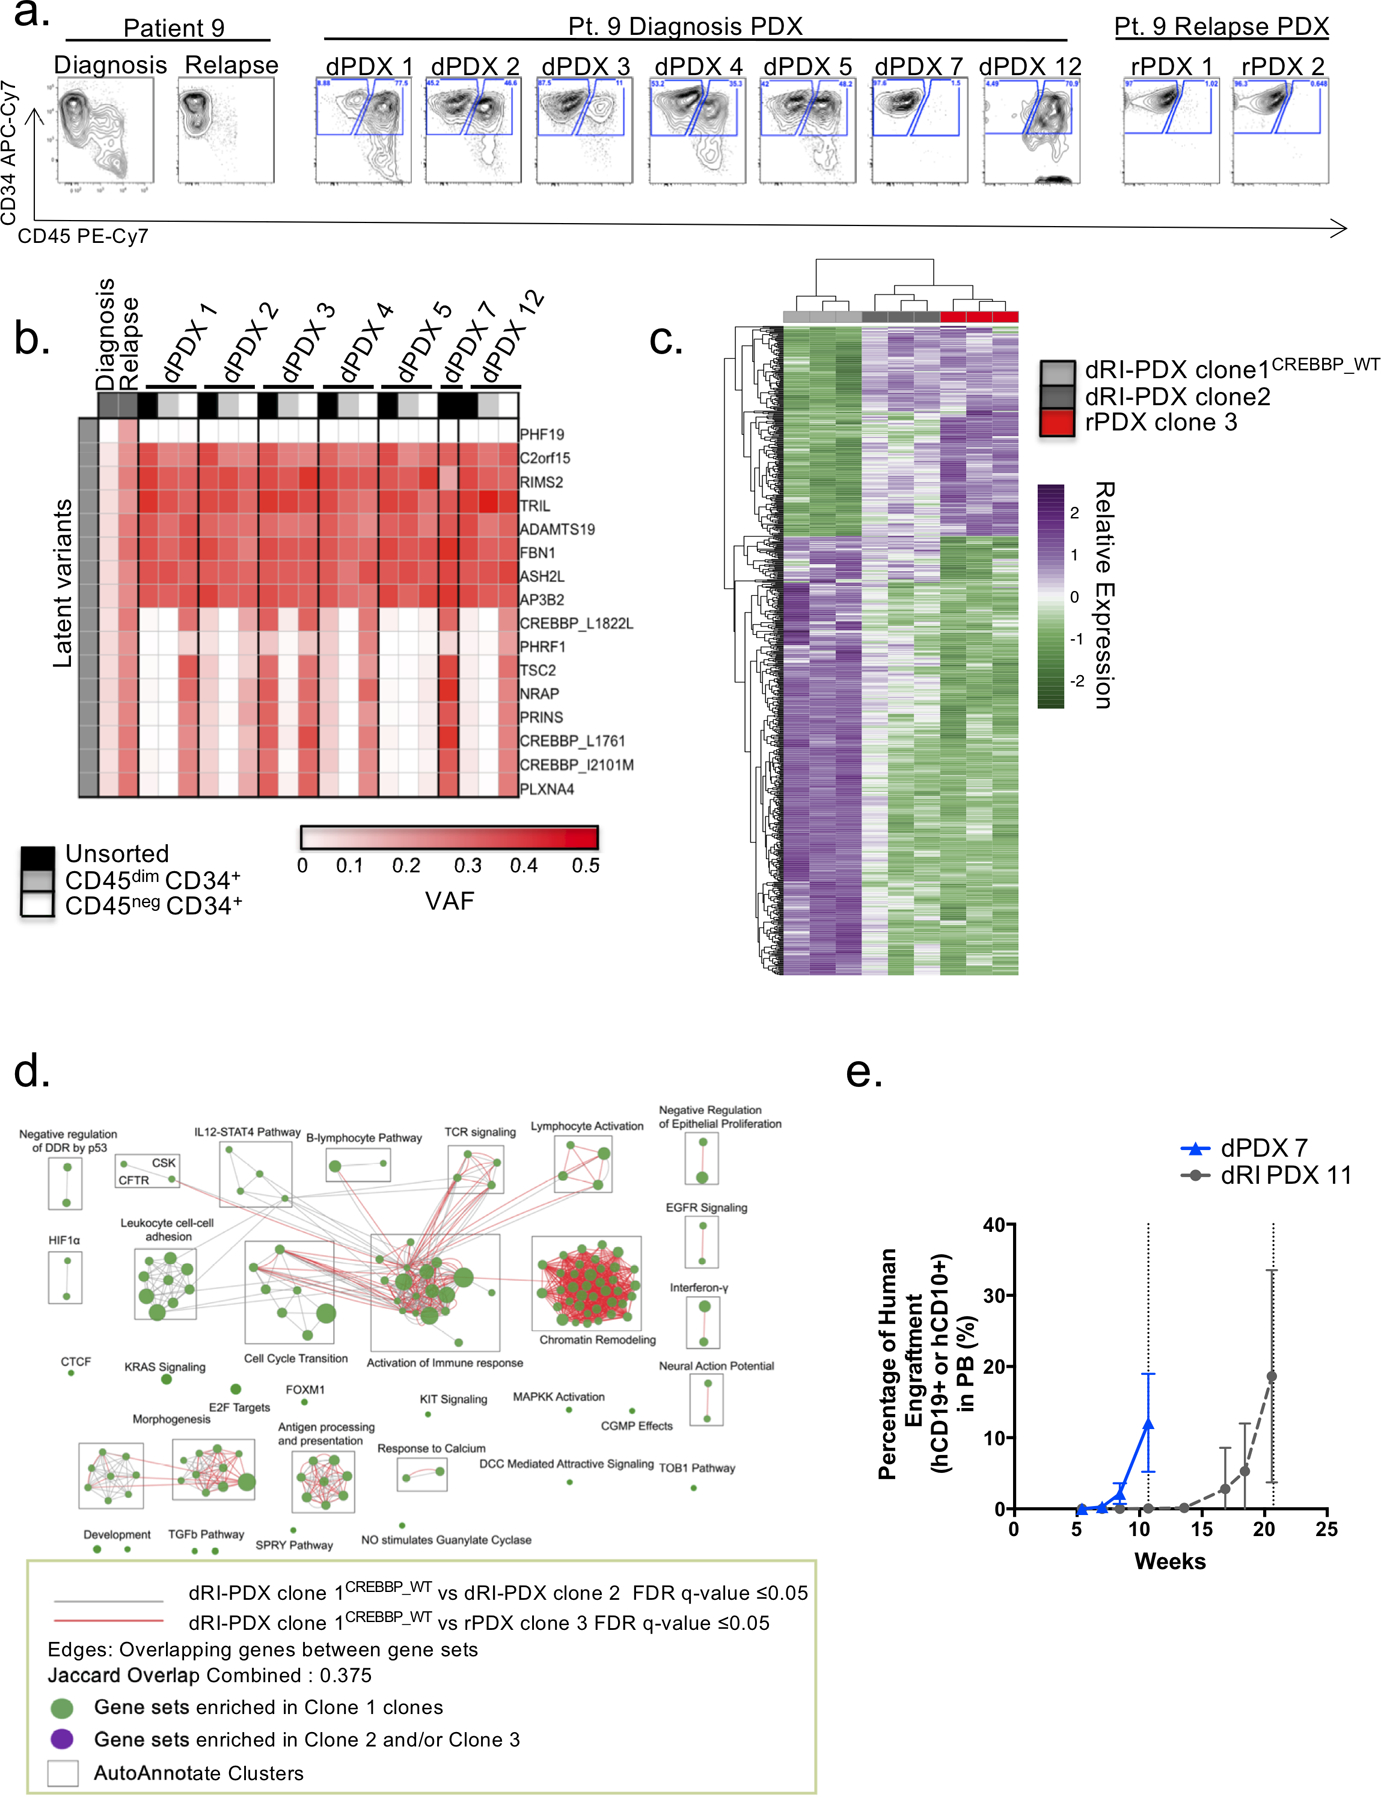
a.Flow cytometry analysis of patient samples and representative dPDX and rPDX of patient 9 display the presence of two different immunophenotypic populations: a CD45dimCD34+ and a CD45negCD34+. b.Targeted sequencing of the dPDX revealed variability in the VAF of latent variants that corresponded with the shift in immunophenotypic populations. Cell sorting for immunophenotypic populations followed by targeted sequencing revealed the isolation of the latent variants in the CD45negCD34+ population. c. RNA-sequencing analysis of differentially expressed genes (adjusted p-value of < 0.05 and absolute log2 fold change of > 1) between the two dPDX (dRI-PDX clone 2; dRI-PDX clone 1CREBBP_WT) vs rPDX for Patient 9. Relative expression was generated from variance stabilized normalized counts. d. Enrichment map of gene sets differentially enriched in patient 9 dRI-PDX clone 1CREBBP_WT vs dRI-PDX clone 2 (FDR q value ≤ 0.05) and dRI-PDX clone 1CREBBP_WT vs rPDX clone 3 (FDR q value ≤ 0.05). Node size is proportional to the number of genes included in each gene set (minimum 10 genes/gene set). Grey and Red edges indicate gene overlap. Green node: enrichment in dRI-PDX clone 1CREBBP_WT (positive NES). Purple node: enrichment in dRI-PDX clone 2 and/or rPDX clone 3 (negative NES). Autoannotate app in Cytoscape was used to automatically annotate clusters (black squares). NES: normalized enrichment score; DDR: DNA Damage Response; TCR: T-Cell Receptor; UPR: Unfolded Protein Response; cGMP: cyclic Guanosine Monophosphate; DCC: Deleted in Colorectal Cancer gene; NO: Nitric Oxide; CSK: C-terminal Src Kinase; CFTR: Cystic Fibrosis Transmembrane Conductance Regulator; SPRY: Sprouty gene. e. Human purified cells from primary dPDX and dRI-PDX from patient 4 were transplanted into secondary NSG recipients. Mice were monitored for peripheral blood human chimerism until mean blood levels reached greater than 10% revealing different kinetics of chimerism between dPDX 7 and dRI-PDX 11. Symbols represent the mean chimerism value of dPDX 7 (n= 20 mice) and dRI-PDX 11 (n= 16 mice) and bars represent standard deviation.