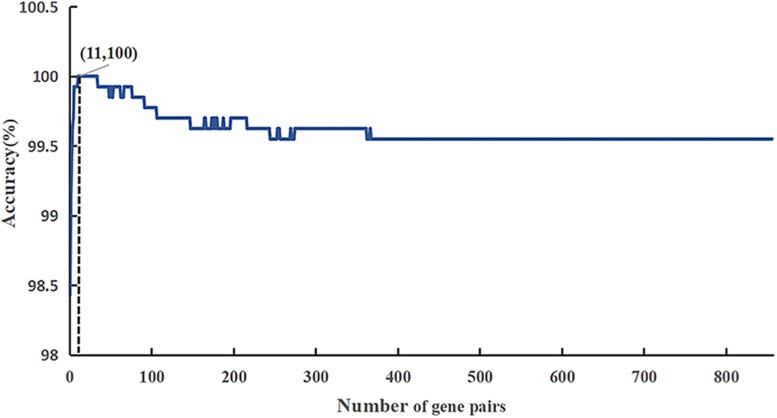
FIGURE 2.
A plot showing the IFS procedure for identifying HCC. When the top 857 features optimized by mRMR were used to perform prediction, the overall success rate reaches an IFS peak of 100% in fivefold cross validation. The solid line represents the ROC curve. The dotted line represents the strategy of randomly guess.

