
Fig. 6.
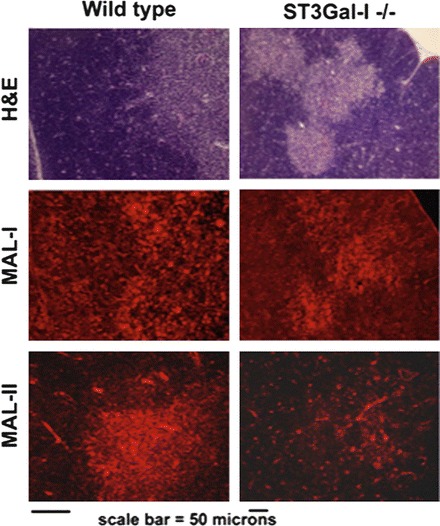
Differences in binding to frozen sections of mouse thymus, from wild type animal (left column) and from ST3Gal-I homozygous mutant (right column) observed with MAL-I and MAL-II, detected using the Cy3 fluorescent streptavidin label. Top row shows hematoxylin and eosin stained sections of the thymus, with dark blue cortex and lighter staining medulla. Middle row shows binding of MAL-I to thymus from both wild type (left) and ST3Gal-I null animals (right). Bottom row shows binding of MAL-II (MAH) lectin to the thymic medulla of the wild type mouse (left) and only minimally to structures in the thymic medulla from ST3Gal-I null mouse (right). Scale bar = 500 μm