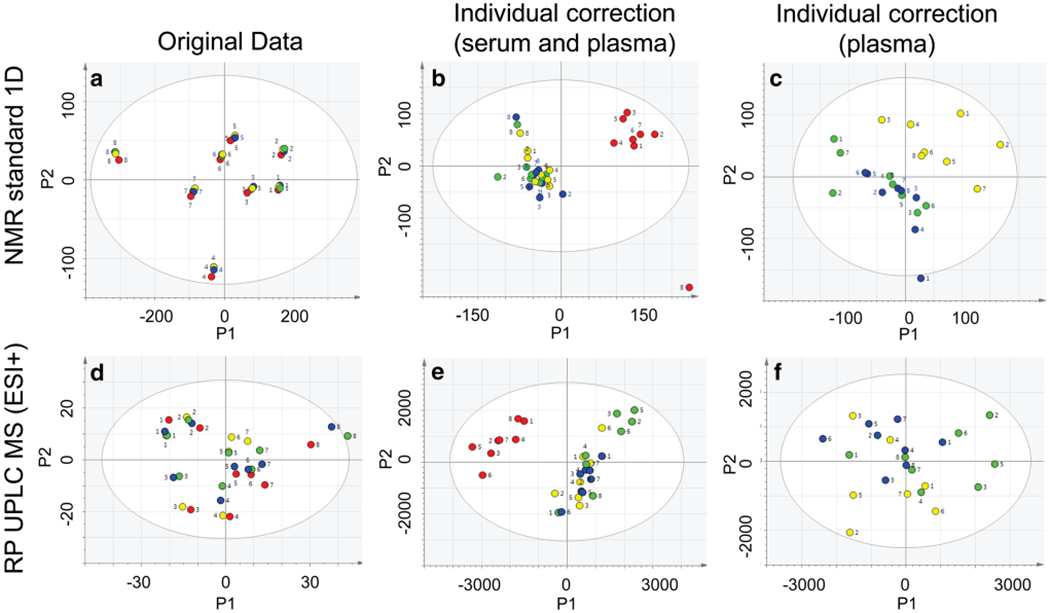
Fig. 1.

Principal components analysis (PCA) scores plots of 1H NMR standard 1D and RP UPLC-MS (ESI+) data evaluating variation among serum and plasma samples. PCA scores plots (PC1 and PC2) from serum (red), platelet rich plasma (yellow), platelet poor plasma (blue), and platelet free plasma (green) are presented before (a, d) and after applying individual correction using all sample types (b, e) or using plasma samples only (c, f). The numbers correspond to the individual donors who provided the samples
