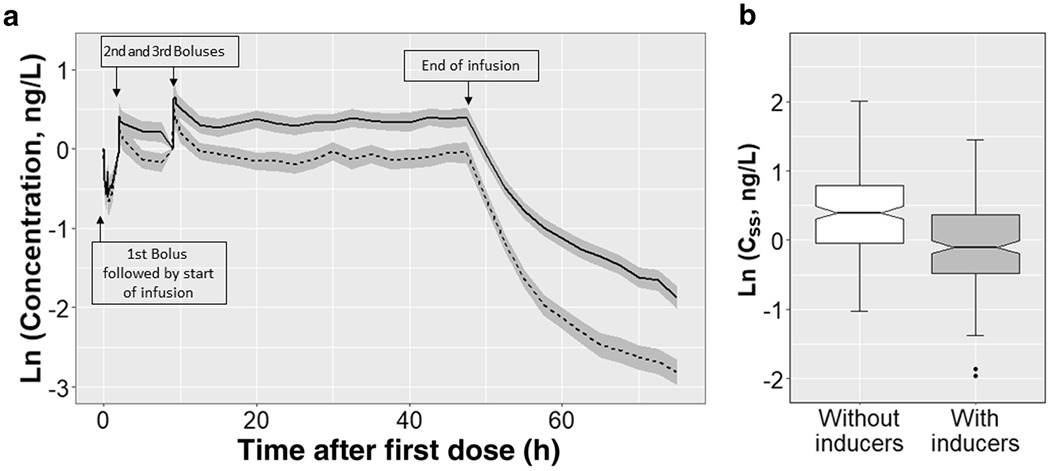
Figure 3.

Simulated concentration-Time profile of fentanyl in the presence (dotted line) or absence (solid line) of CYP3A4/5 inducers (A). The lines indicate the mean values while the shaded areas indicate 95% confidence intervals. (B) Box-plot comparing the distribution of Css (steady state concentration) values with or without coadministration of CYP3A4/5 inducers. Patients on inducers at the same time as fentanyl have significantly lower Css as compared to those not on inducers. Each of the fentanyl bolus doses were 1 μg/kg while infusion was administered at 1 μg/kg/hr.
