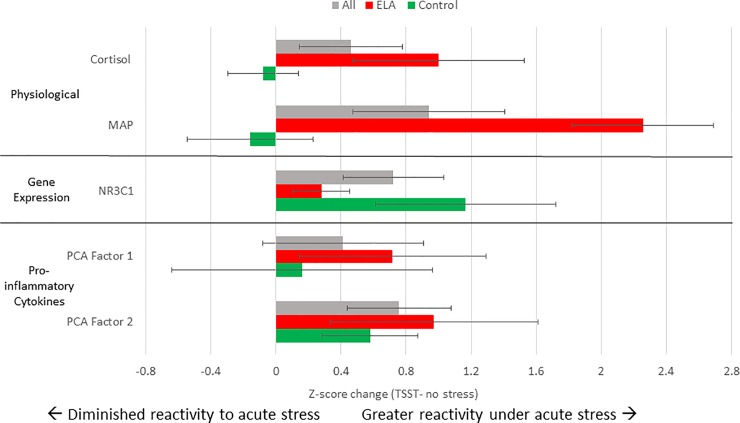
Fig 2. Normalized change score for physiological, gene expression, and pro-inflammatory cytokine response to the TSST relative to the no-stress session for ELA group, control group and full sample.
Change scores were calculated by standardizing summary AUCi using data from both sessions and subtracting participant values from the no-stress session from those in the TSST session. Error bars represent standard error of the mean. Change scores are expressed for the full sample (grey), ELA group (red), and control group (green).

