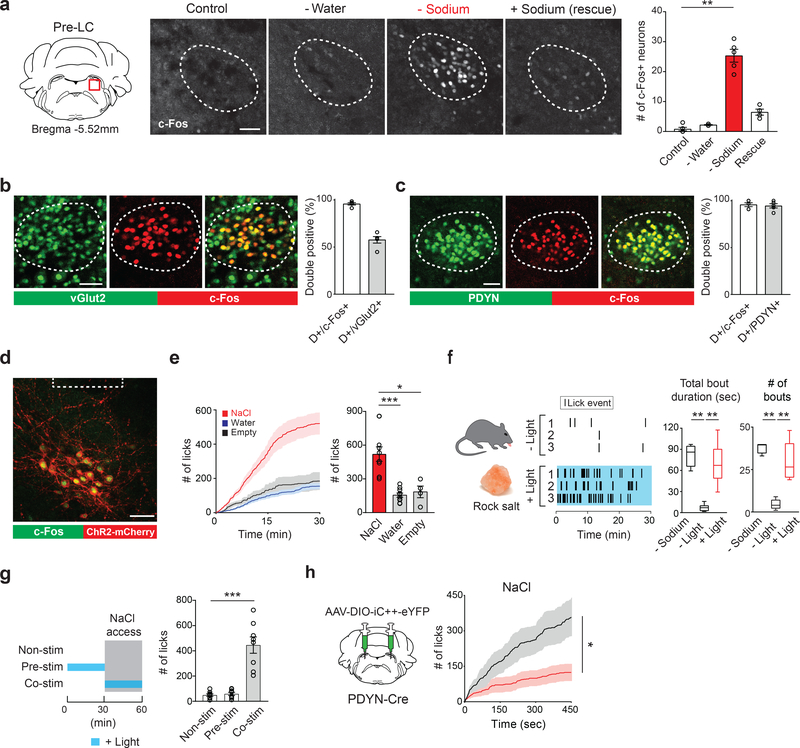
Figure 1. Genetic and functional identification of sodium appetite neurons in the pre-LC.
a, c-Fos expression in sated (control), water-deprived, sodium-depleted, or sodium-repleted (rescue) animals. Quantified data are shown (n = 4 mice for rescue, n = 5 mice for other conditions). b, Sodium-depletion activates pre-LC excitatory neurons (n = 5 mice). D+ denotes double-positive. c, c-Fos expression fully overlaps with PDYN-positive neurons visualized in PDYN/Ai110 transgenic mice (n = 5 mice). d, Representative image of optic fiber placement in the pre-LC. e, Photostimulation of pre-LCPDYN neurons triggered ingestion of NaCl solution (0.5 M, n = 10 mice) compared to water (n = 10 mice) or empty spout (n = 4 mice). f, Photostimulated mice showed robust licking behavior toward rock salt (n = 4 for – Sodium and n = 8 for the rest). Raster plots of 3 out of 8 mice are shown. g, A scheme of photostimulation and sodium presentation (left panel). The number of licks for 30 min was quantified (right panel, n = 8 mice). h, Photoinhibition of pre-LCPDYN neurons by iC++ significantly reduced sodium intake (n = 7 mice). Scale bar, 50 μm.*P<0.05, **P<0.01 and ***P<0.001 by Kruskal–Wallis, Friedman test (Dunn’s multiple comparison), or two-tailed Wilcoxon test. Data presented as mean ± s.e.m. Box plots show median, quartiles (boxes), and range (whiskers).

