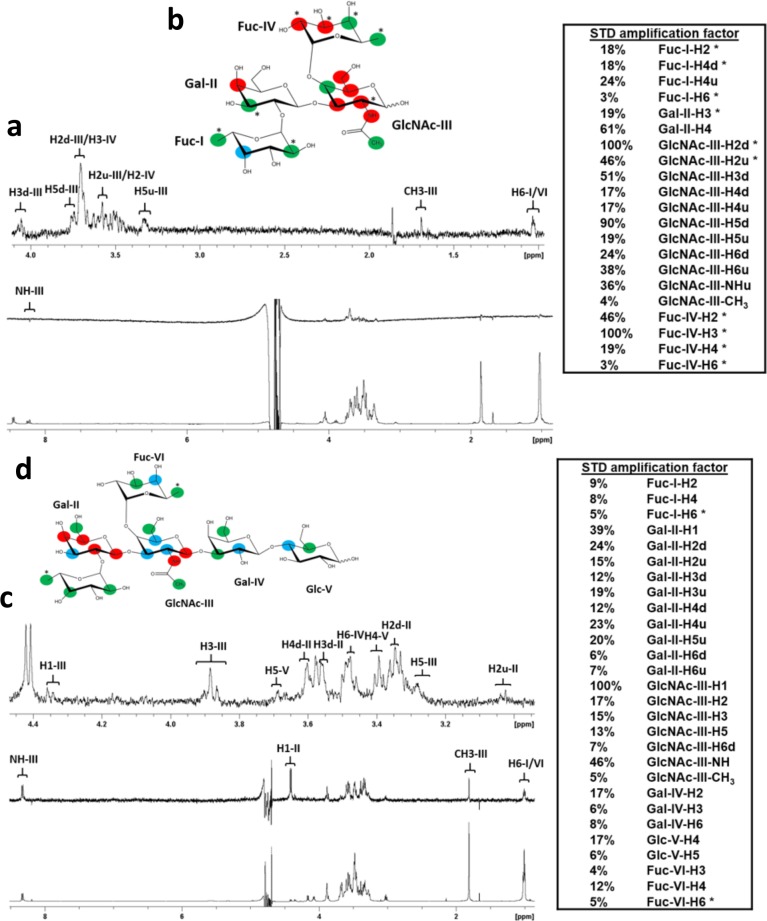
Fig 2. STD NMR analysis of Leb tetrasaccharide and LNDFH I glycan interactions with the P[8] VP8* domain.
(a) NMR spectra of Leb tetra-saccharide in complex with P[8] VP8*. The bottom spectrum in (a) is 1H NMR reference spectrum of P[8] VP8* (33 μM) with Leb tetra-saccharide (1.86 mM). The middle spectrum in (a) is STD NMR spectrum of P[8] VP8* (33 μM) with Leb tetra-saccharide (1.86 mM). The protein was saturated with a cascade of 40 Gaussian-shaped pulses at 0.11 ppm, and the off-resonance was set to 50 ppm. The upper spectrum in (a) is the expansion of the STD NMR from 4.1 to 0.9 ppm. (b) The epitope mapping of Leb tetra-saccharide when bound to P[8] based on the STD effects: red, strong STD NMR effects (>30%); blue, medium STD NMR effects (20%-30%); green, weak STD NMR effects (<20%). (c) NMR spectra pf LNDFH I in complex with P[8] VP8*. The bottom spectrum in (c) is 1H NMR reference spectrum of P[8] VP8* (46 μM) with LNDFHI (2.3 mM). The middle spectrum in (c) is STD NMR spectrum of P[8] VP8* (46 μM) with LNDFHI (2.3 mM). The protein was saturated with a cascade of 40 Gaussian-shaped pulses at -0.25 ppm, and the off-resonance was set to 50 ppm. The upper spectrum in (c) is the expansion of the STD NMR from 4.5 to 3.0 ppm. (d) The epitope mapping of LNDFH I when bound to P[8] based on the STD effects: red, strong STD NMR effects (>20%); blue, medium STD NMR effects (10%-20%); green, weak STD NMR effects (<10%). “*” means the overlapping of signals in the STD NMR spectrum. “d” indicates a downfield proton, “u” indicates an upfield proton.

