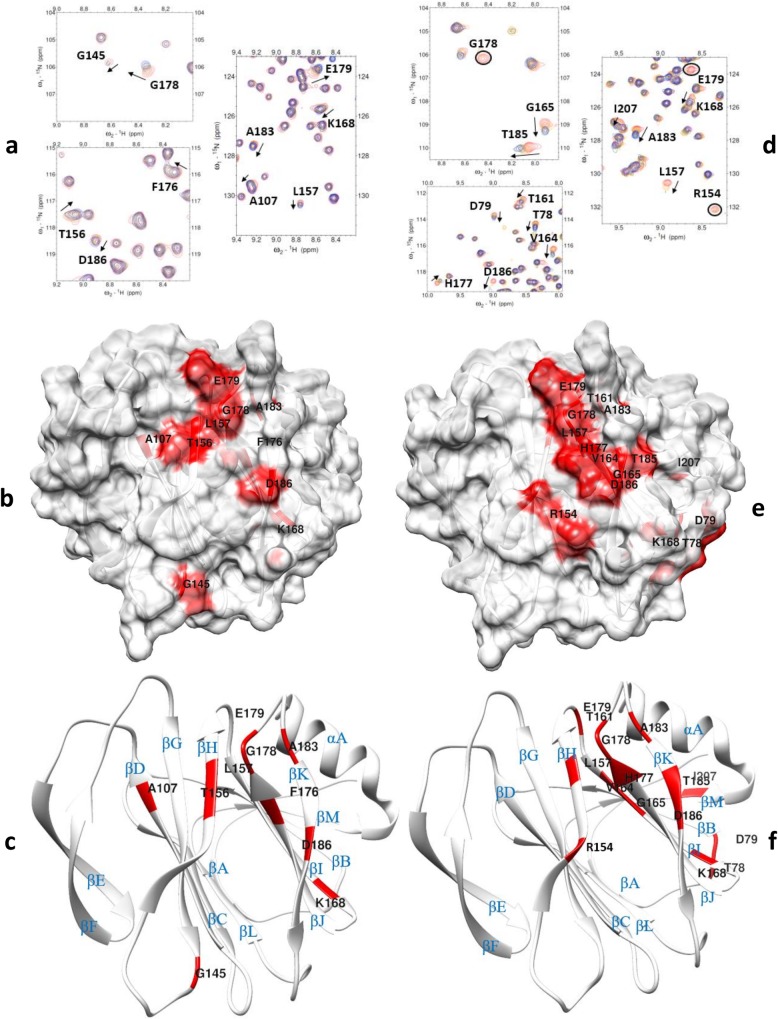
Fig 4. NMR titration analysis of P[8] VP8* domain with Leb and LNDFH I glycans.
(a) Chemical shift changes in P[8] VP8* [PDB ID: 2DWR] upon addition of Leb tetra-saccharide. The NMR data correspond to increasing ligand/protein ratios of 0:1 (red), 8:1 (orange), 18:1 (green), and 30:1 (blue). (b) Location of the large chemical shift changes on the P[8] VP8* surface [PDB ID: 2DWR] upon binding to Leb tetra-saccharide. Amino acids with chemical shift changes greater than 2.5σ or disappeared after titration are colored with red. (c) Ribbon Diagram shows the location of large chemical shift changes on the P[8] VP8* surface upon binding to Leb tetra-saccharide. The secondary structure is labeled. (d) Chemical shift changes in P[8] VP8* upon addition of LNDFH I. The NMR data correspond to increasing ligand/protein ratios of 0:1 (red), 6:1 (orange), 18:1 (green), and 25:1 (blue). The arrows show residues that have chemical shifts changes upon titration. Peaks that disappeared upon titration are circled. (e): Location of the large chemical shift changes on the P[8] VP8* surface [PDB ID: 2DWR] upon binding to LNDFH I. Amino acids with chemical shift changes greater than 1.5σ or disappeared after titration are colored with red. (f): Ribbon Diagram shows the location of large chemical shift changes on the P[8] VP8* surface upon binding to LNDFH I. The secondary structure is labeled.

