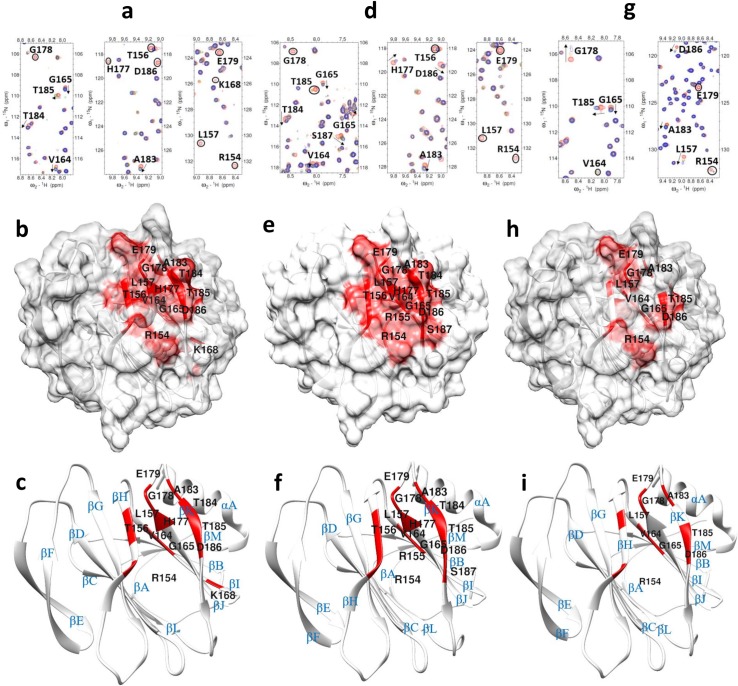
Fig 6. NMR titration analysis of P[8] VP8* mutants with LNDFH I glycan.
(a) Chemical shift changes in T78A P[8] VP8* upon addition of LNDFH I. The NMR data correspond to increasing ligand/protein ratios of 0:1 (red), 8:1 (orange), 12:1 (green), and 16:1 (blue). (b) Location of the large chemical shift changes on the T78A P[8] VP8* surface upon binding to LNDFH I. (c) Ribbon Diagram shows the location of large chemical shift changes on the T78A P[8] VP8* surface upon binding to LNDFH I. (d) Chemical shift changes in D79A P[8] VP8* upon addition of LNDFH I. The NMR data correspond to increasing ligand/protein ratios of 0:1 (red), 8:1 (orange), 12:1 (green), and 16:1 (blue). (e) Location of the large chemical shift changes on the D79A P[8] VP8* surface upon binding to LNDFH I. (f) Ribbon Diagram shows the location of large chemical shift changes on the D79A P[8] VP8* surface upon binding to LNDFH I. (g) Chemical shift changes in K168A P[8] VP8* [PDB ID: 2DWR] mutant upon addition of LNDFHI. The NMR data correspond to increasing ligand/protein ratios of 0:1 (red), 8:1 (orange), 12:1 (green), and 16:1 (blue). (h) Location of the large chemical shift changes on the K168A P[8] VP8* surface upon binding to LNDFHI. (i) Ribbon Diagram shows the location of large chemical shift changes on the K168A P[8] VP8* surface upon binding to LNDFHI. The secondary structure is labeled. The threshold values obtained from WT-P[8] titrated with LNDFHI were used to determine the amino acids that show large chemical shift changes, with peaks changes greater than 1.5σ or disappeared are colored with red. The arrows in the spectra show residues that have chemical shifts changes upon titration, and peaks that disappeared upon titration are circled.

