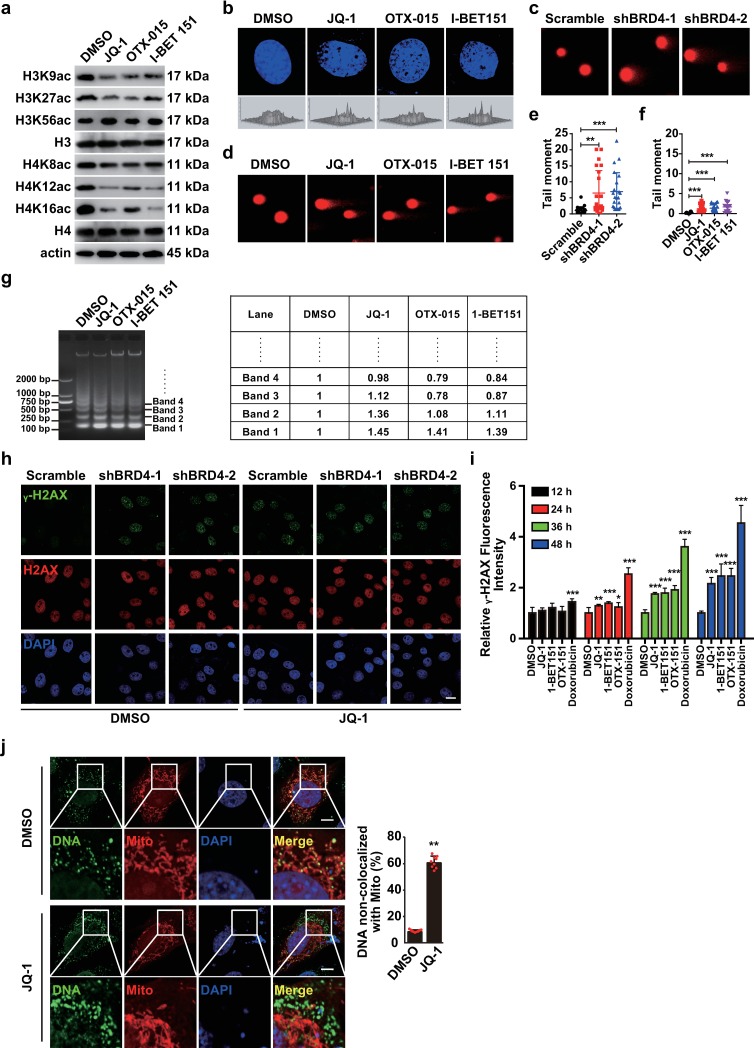
Fig 7. BRD4 inhibition induces chromatin decompaction and DDR.
(a) Different acetylated lysine residues of histone H3 and H4 were assessed with immunoblotting in HEK293 cells treated with DMSO, JQ-1 (1 μM), OTX-015 (10 μM) and I-BET 151 (10 μM) at 37°C for 24 h. Actin served as a loading control. (b) Nuclear DNA structure was assessed with DAPI staining in NIH/3T3 cells treated with DMSO, JQ-1 (1 μM), OTX-015 (10 μM) and I-BET 151 (10 μM) for 24 h. (c and d) DNA damage was detected with comet assays in Scramble, shBRD4-1 and shBRD4-2 PK15 cells (c) or in NIH/3T3 cells (d) treated with DMSO, JQ-1 (1 μM), OTX-015 (10 μM) and I-BET 151 (10 μM) for 24 h. (e and f) Quantification of the tail moment for c (e) and d (f). Data are shown as mean ± SD of the tail moment of n = 22 cells. ** P < 0.01, *** P < 0.001 determined by two-tailed Student’s t-test. (g) Chromatin compaction was assessed with micrococcal nuclease assays in NIH/3T3 cells treated with DMSO, JQ-1 (1 μM), OTX-015 (10 μM) and I-BET 151 (10 μM) for 24 h. Quantification of band intensity by densitometry is shown on the right. (h) γ-H2AX and H2AX were assessed with immunofluorescence in Scramble, shBRD4-1 and shBRD4-2 PK15 cells treated with DMSO or JQ-1 (1 μM) for 24 h. Scale bar, 10 μm. (i) Quantification of γ-H2AX signal in NIH/3T3 cells treated with DMSO, JQ-1 (1 μM), OTX-015 (10 μM), I-BET 151 (10 μM) and doxorubicin (100 nM) for 12–48 h by Cytation5 (Biotek). Data are shown as mean ± SD based on three independent experiments. * P < 0.05, ** P < 0.01, *** P < 0.001 determined by two-tailed Student’s t-test. (j) Co-localization of mitochondria with cytosolic DNA was assessed with immunofluorescence with antibodies against Tom20 (Mito) and dsDNA (DNA) in NIH/3T3 cells treated with DMSO and JQ-1 (1 μM) for 24 h. Quantification of DNA non-colocalized with mitochondria is shown on the right. Data are shown as mean ± SD of the tail moment of n = 22 cells. ** P < 0.01 determined by two-tailed Student’s t-test. Scale bar, 10 μm.

