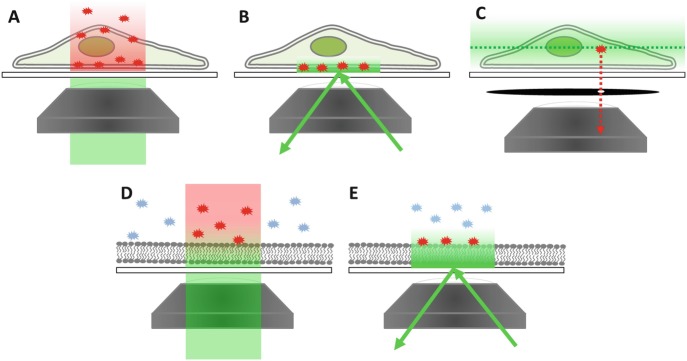
Fig. 2.3.
Microscope configurations for viewing virus interactions with cells and biomimetic membrane surfaces. Green color denotes excitation light and red denotes emission light. (a) The epifluorescence configuration illuminates an entire light path through the cell and excites any fluorophores within it, making it impossible to track virions in live cells this way due to the overall background signal. (b) TIRF microscopy illuminates a thin layer near the interface between the glass microscope slide and buffer solution. Cell membranes residing in this zone with fluorescently labeled virions can be visualized as individuals, provided they are far enough apart from each other. (c) Confocal microscopy with a pinhole arrangement can examine specific Z-planes within the cell and block out nearly all background signals from the surrounding media excited by out-of-plane light. Here, the green dashed line denotes the focal plane of excitation, the green gradient denotes out-of-plane light, and the red star and its dashed line arrow indicate only the emission from this fluorophore travel to the camera. (d) Epifluorescence illumination in the biomimetic membrane platform suffers the same poor background issue as whole cells when fluorescently labeled virions are in the bulk. (e) TIRF microscopy enables individual virion visualization bound to the membrane surface without exciting those in the bulk above it

