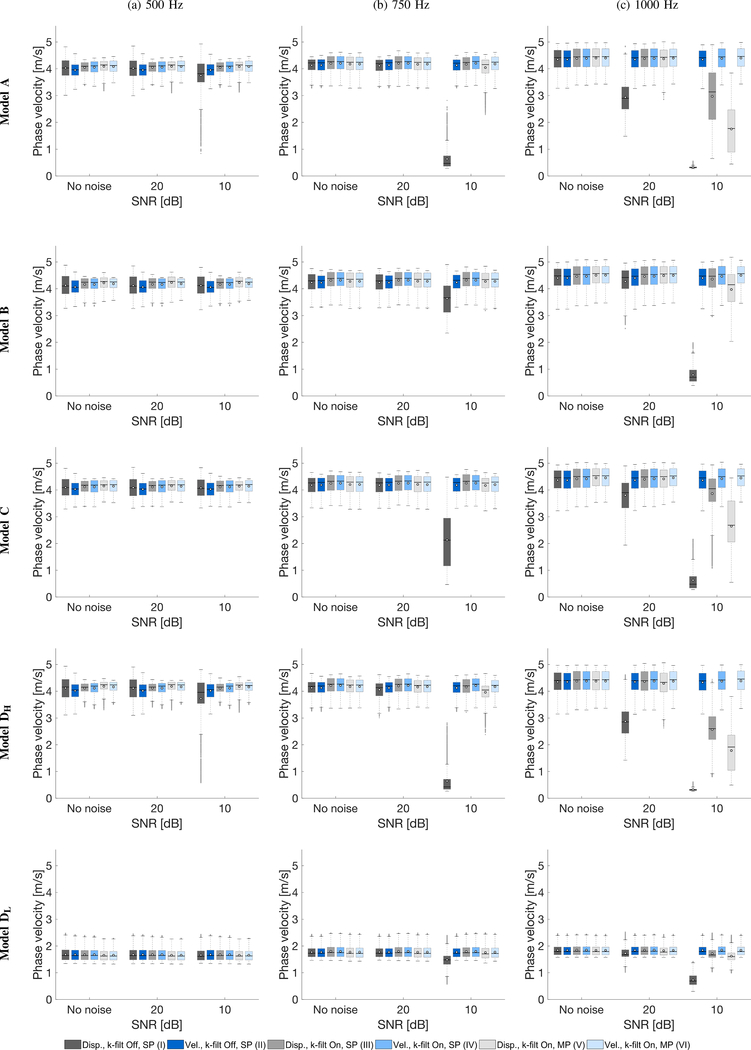
Fig. 9:
Boxplots of phase velocity, of the inclusion for various numerical LISA models data and noise levels. White circles represent mean values whereas, a solid line within the box corresponds to a median value. Results were calculated for various LPVI processing scenarios tabulated in Table I. Analogous boxplots for an SNR of 15 and 5 dB are presented in the Supplementary material in Fig. S1.

