
Fig. 2.13.
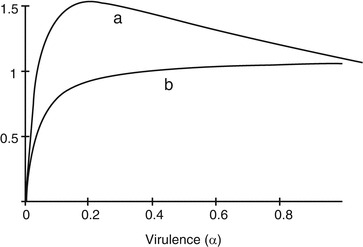
Graph of relationship between two sources of infection (or two habitats) or two hosts assessed as pathogen-induced mortality. Curve a is the relationship between R 0 virulence when the source is a living host; b is the relationship between R 0 and virulence when the source is a dead host. Which curve obtained depends on the relative contribution of both living and dead hosts to the overall R 0