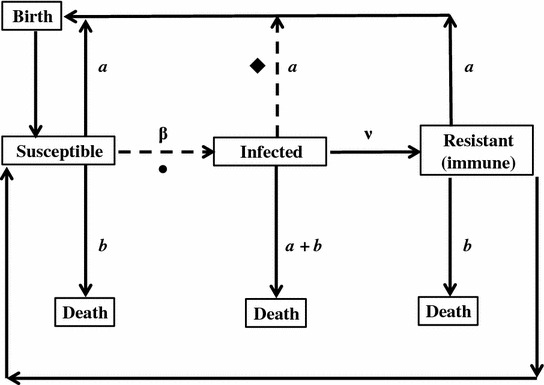
Fig. 5.1.

Flow chart of the original compartment model of microparasite impacts on host populations based on population pools of susceptible, infected, resistant individuals (modified from Anderson and May 1979). Hosts shift from susceptible to infected as a function of transmission rate (β) and infected to resistant as a function of survival of infection (v), while birth (a) and death (b, a + b for infected hosts) rates drive population dynamics. Variation in host social behavior could impact β (•), which mediates the number of infected individuals as well as the subsequent fitness of infected individuals via reproductive rate (♦)
