
Figure 4: IDO1 inhibition enhances CRC radiation sensitivity in vivo.
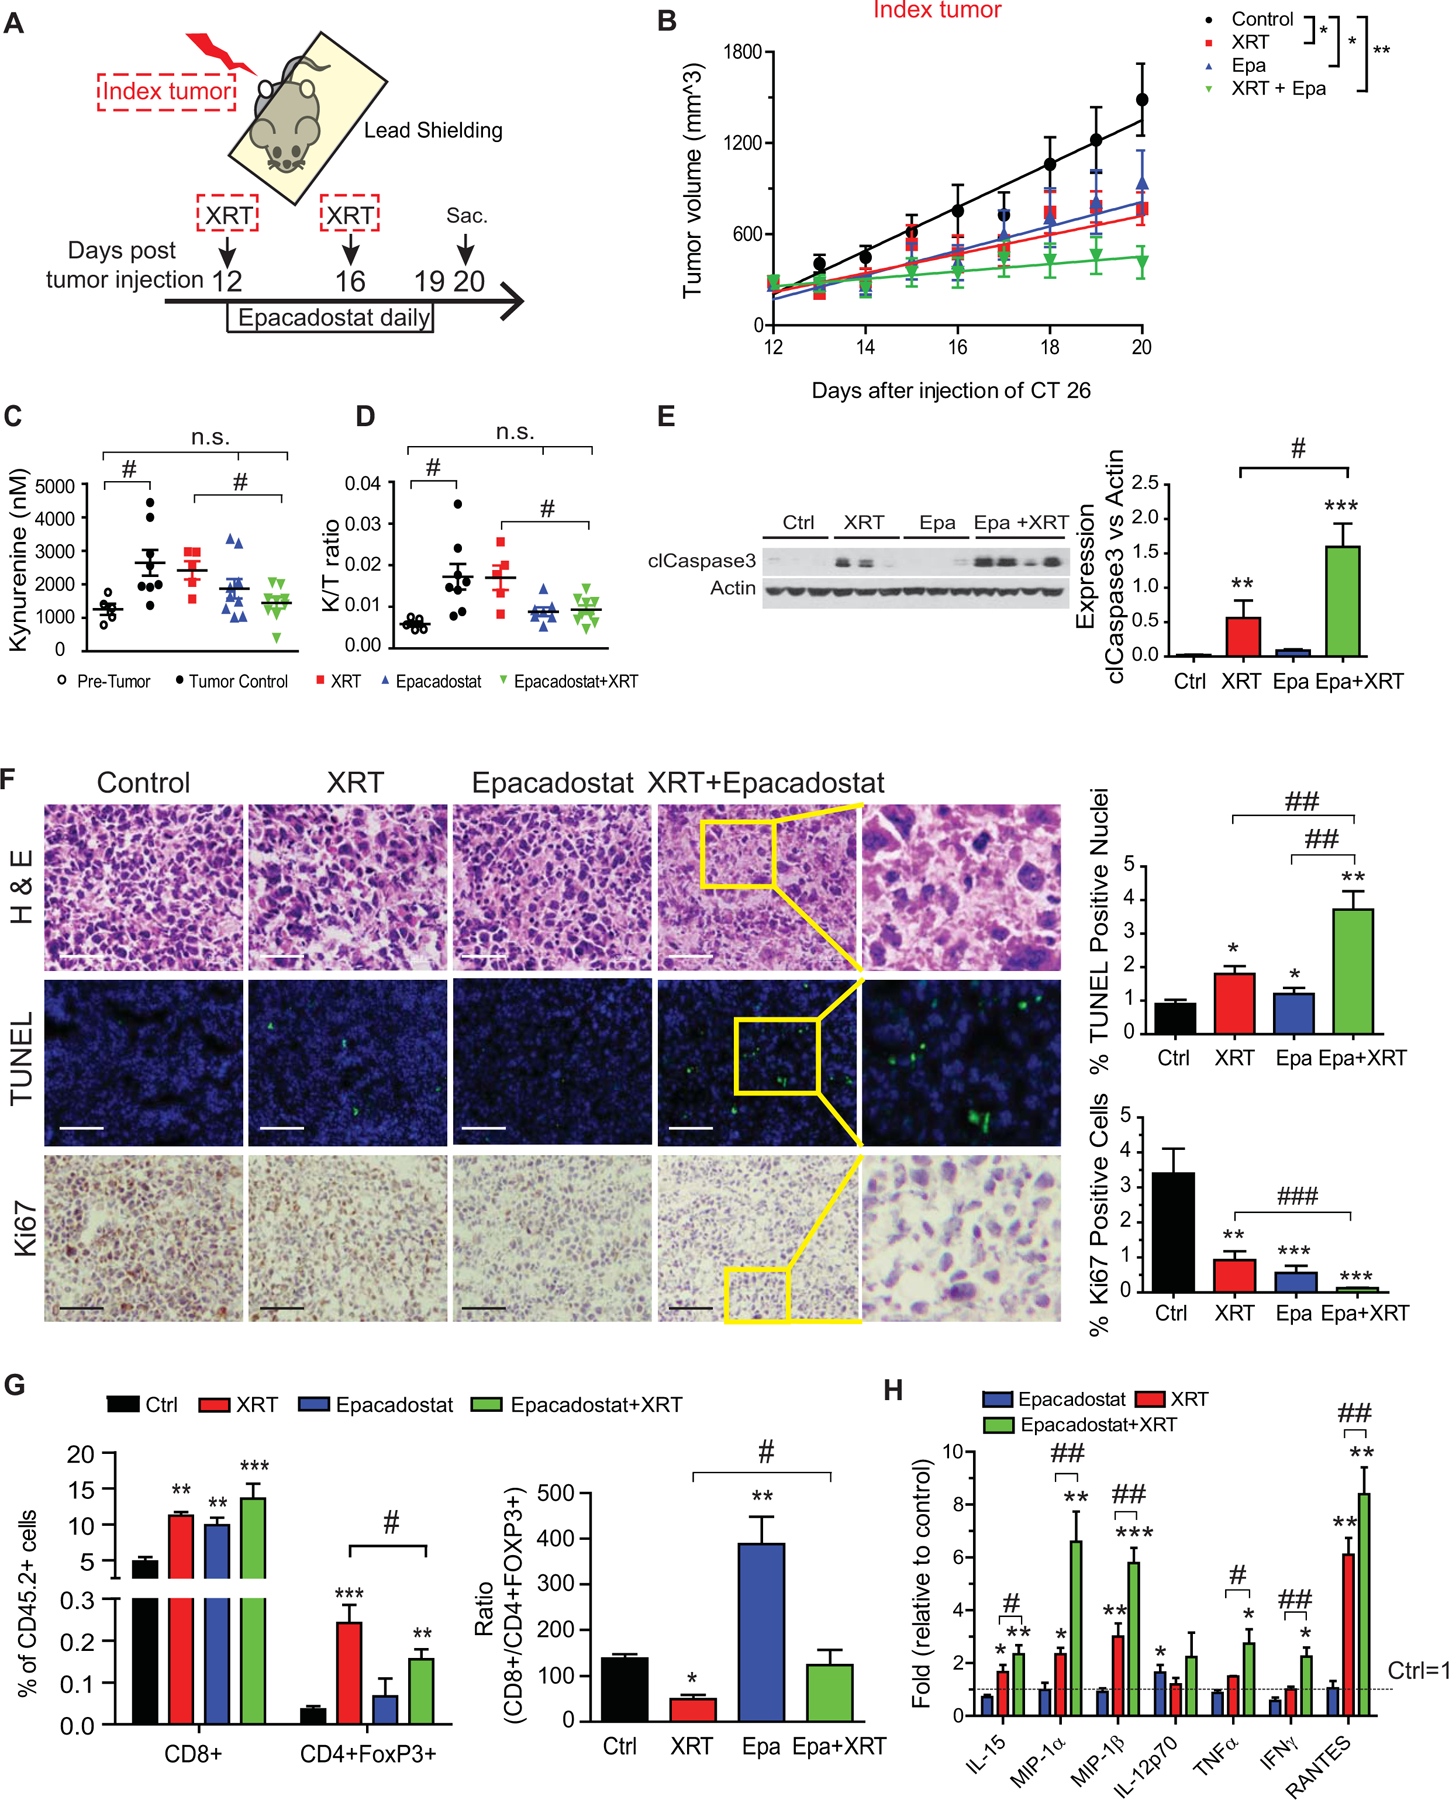
CRC was modeled using a syngeneic tumor graft of CT26 cells (1×10⁶) injected into bilateral hind legs of BALB/c mice. Treatments included no therapy (control), radiation therapy alone (XRT, 6 Gy × 2), epacadostat (Epa) alone, and XRT plus Epa. n=5/group. A, Experimental setup. Mice were serpentine sorted into groups based on the size of the index tumors. Epa (6 mg) or vehicle control was gavaged daily 2 hours before XRT. Index tumor indicates the tumor that received XRT. Sac: sacrificed B, Changes in tumor size over time illustrated with average volume and best-fit linear representation based on mixed effects model. *p<0.05, **p<0.01. C, Plasma kynurenine and D, kynurenine to tryptophan (K/T) ratio of treatment groups and pre-tumor control mice (n=5–10 mice/group). E, Apoptosis as measured by cleaved caspase-3 (clCasp3) in tumor protein lysates harvested on day 20 post-implantation. Representative Western blot images with each lane reflecting an individual mouse tumor (left) and summarized quantification relative to actin (right). n=3–4. F, Representative images of tumors from treatment groups stained as indicated. TUNEL (apoptosis) and Ki67 (proliferation) quantitation provided at right. Bars in micrograph=40 μm. G, Tumor-infiltrating cytotoxic (CD8+) and regulatory (CD4+FoxP3+) T-cell populations expressed as a percentage (left) and ratio (right) of all tumor-infiltrating CD45.2+ lymphocytes (TILs). Results from 1 of 2 independent experiments. H, Cytokine analysis of index tumor protein lysates using Multiplex Cytokine Array. The values from mice receiving no treatment was set as 1. n=5–6/group. Mean+SEM. *P<0.05, **P<0.01, ***P<0.001 by Student’s t test compared to control. #P<0.05, ##P<0.01 by Student’s t test compared as indicated by the bracket.