
Figure 5: IDO1 inhibition enhances the abscopal effect of radiation in distant CRC tumors.
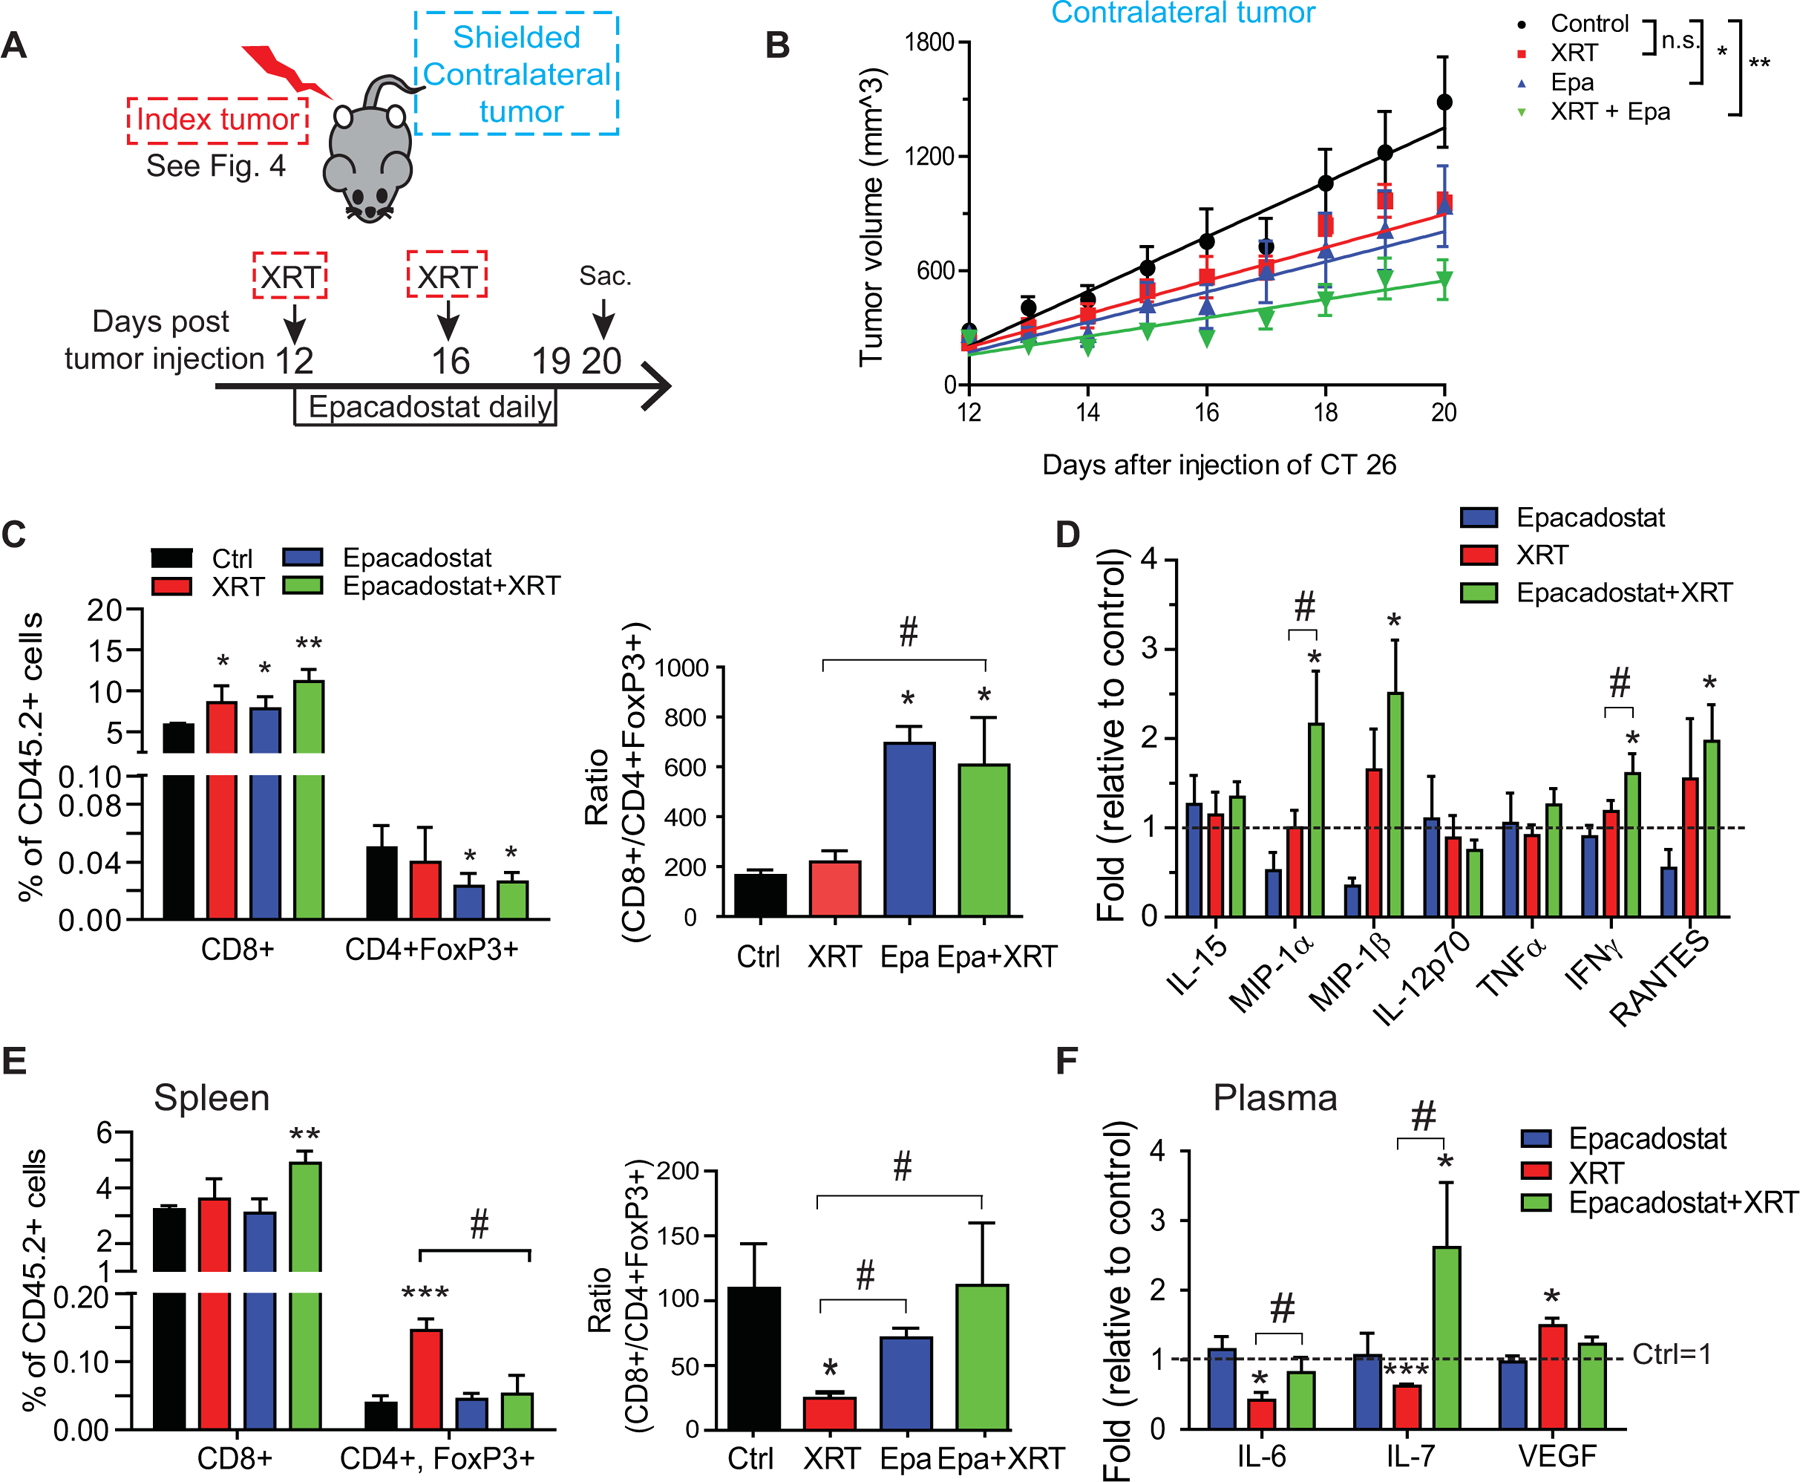
A, Experimental setup is as described in Figure 4. Data in this figure represents the contralateral (shielded) tumors. B, Changes in tumor volume over time. Best-fit linear curve and comparative statistics were assessed by mixed-effects modeling. Mean+SEM. *p<0.05, **p<0.01. n=5/group. C, Tumor-infiltrating cytotoxic (CD8+) and regulatory (CD4+FoxP3+) T-cell populations expressed as a percentage (left) and ratio (right) of all tumor-infiltrating CD45.2+ lymphocytes (TILs). Results from 1 of 2 independent experiments. D, Cytokine profile of contralateral tumor lysates. The values from mice receiving no treatment was set as 1. E, Changes in splenic lymphocyte populations. Left, percent of total CD45.2+ cells; right, the ratio of the CD8+ T cells to Tregs. F, Altered plasma cytokines. The values from mice receiving no treatment was set as 1. n=5–6/group. Mean+SEM. *P<0.05, **P<0.01, ***P<0.001 by Student’s t test compared to control. #P<0.05, ##P<0.01 by Student’s t-test compared as indicated by the bracket.