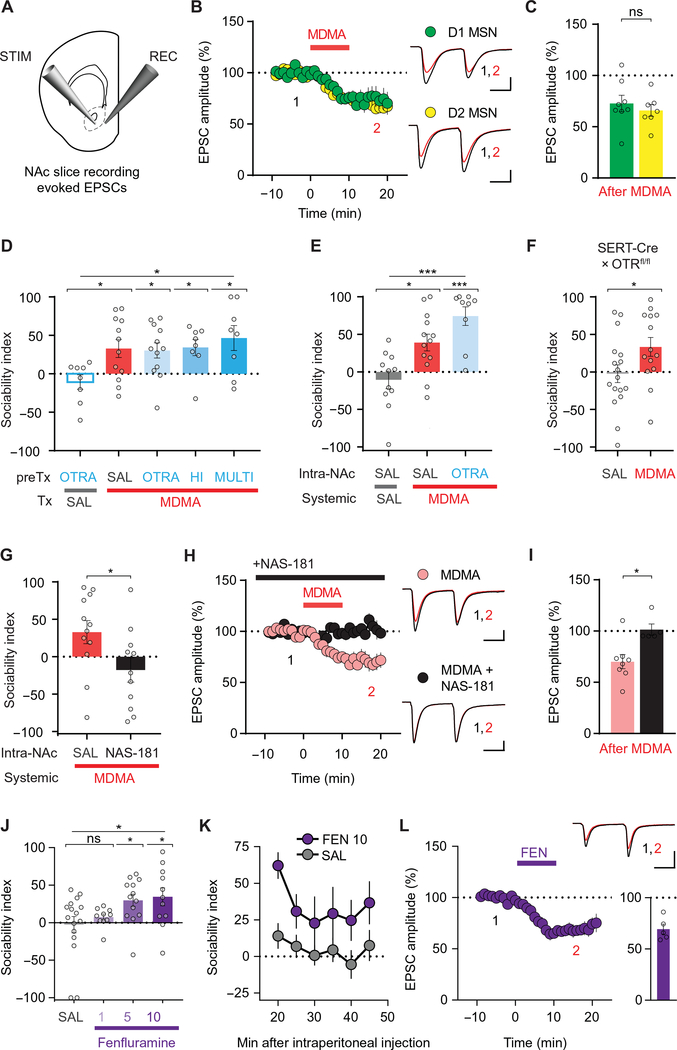
Fig. 4. MDMA’s prosocial effect requires 5-HT release and activation of 5-HT1b receptors in NAc.
(A) Schematic for slice electrophysiology from coronal brain slices containing NAc. (B) Left: Summary time course graph showing the effect of a 10-min bath application of MDMA (10 μM) on EPSC amplitudes recorded from D1 and D2 MSNs. Right, sample EPSC traces taken from time points 1 and 2 as shown. (C) Summary graph shows EPSC amplitudes in D1 and D2 MSNs after MDMA application (n = 7 to 8 cells, 6 to 7 mice). (D) Sociability in mice pretreated with one of several dose regimens of the OxtR antagonist (OTRA), L-368,899, before treatment with MDMA or saline. OTRA + saline group is compared to groups receiving MDMA and pretreatment with the following: saline; OTRA (5 mg/kg once); HI (10 mg/kg once); or MULTI (5 mg/kg every 12 hours for 48 hours preceding MDMA; n = 8 to 12). (E) Sociability in mice pretreated with saline or OTRA infused into the NAc before intraperitoneal treatment with MDMA or saline. Saline-NAc + MDMA-intraperitoneal is compared to saline-NAc + saline-intraperitoneal and OTRA-NAc + MDMA-intraperitoneal groups. Results with two OTRAs, L-368,899 and L-371,257, are pooled (n = 9 to 13). (F) Sociability after saline or MDMA in mice with selective deletion of OxtRs from SERT+ cells (n = 14 to 17). (G) Sociability in mice pretreated with saline or the 5-HT1b receptor antagonist, NAS-181, infused into the NAc before intraperitoneal treatment with MDMA (n = 11 to 12). (H) Summary time course graph showing the effect of continuous bath application of NAS-181 (20 μM) on MDMA-induced depression of NAc EPSC amplitude. Pooled data from D1 and D2 MSNs are shown. Right, sample traces, as in (B). (I) Summary graph of data in (H) (n = 5 to 8 cells, 3 to 5 mice). (J) Sociability after increasing doses of the 5-HT–releasing drug d-fenfluramine (FEN: 1, 5, and 10 mg/kg; n = 10 to 16). (K) Time course of sociability index after FEN injection (10 mg/kg; n = 11) versus saline (SAL; n = 14). (L) Effect of bath application of FEN (10 μM) on the amplitude of EPSCs recorded from NAc MSNs (n = 5, 3 mice). Top right: Sample EPSC traces taken from time points 1 and 2 as shown. Bottom right: Summary graph of FEN-mediated depression of EPSCs. Scale bars, 100 pA, 25 ms in (B) and (H); 200 pA, 25 ms in (L). Data shown are means ± SEM. Significance was determined for each comparison (statistical test): across groups (one-way ANOVA, unmatched) for (D), (E), and (J); between groups (unpaired t test) for (C), (F), (G), and (I); across group time courses (two-way ANOVA, ordinary) for (K); all planned post hoc between-group comparison (t test with Sidak correction for multiple comparisons). *P < 0.05, ***P < 0.001; ns, P > 0.05.

