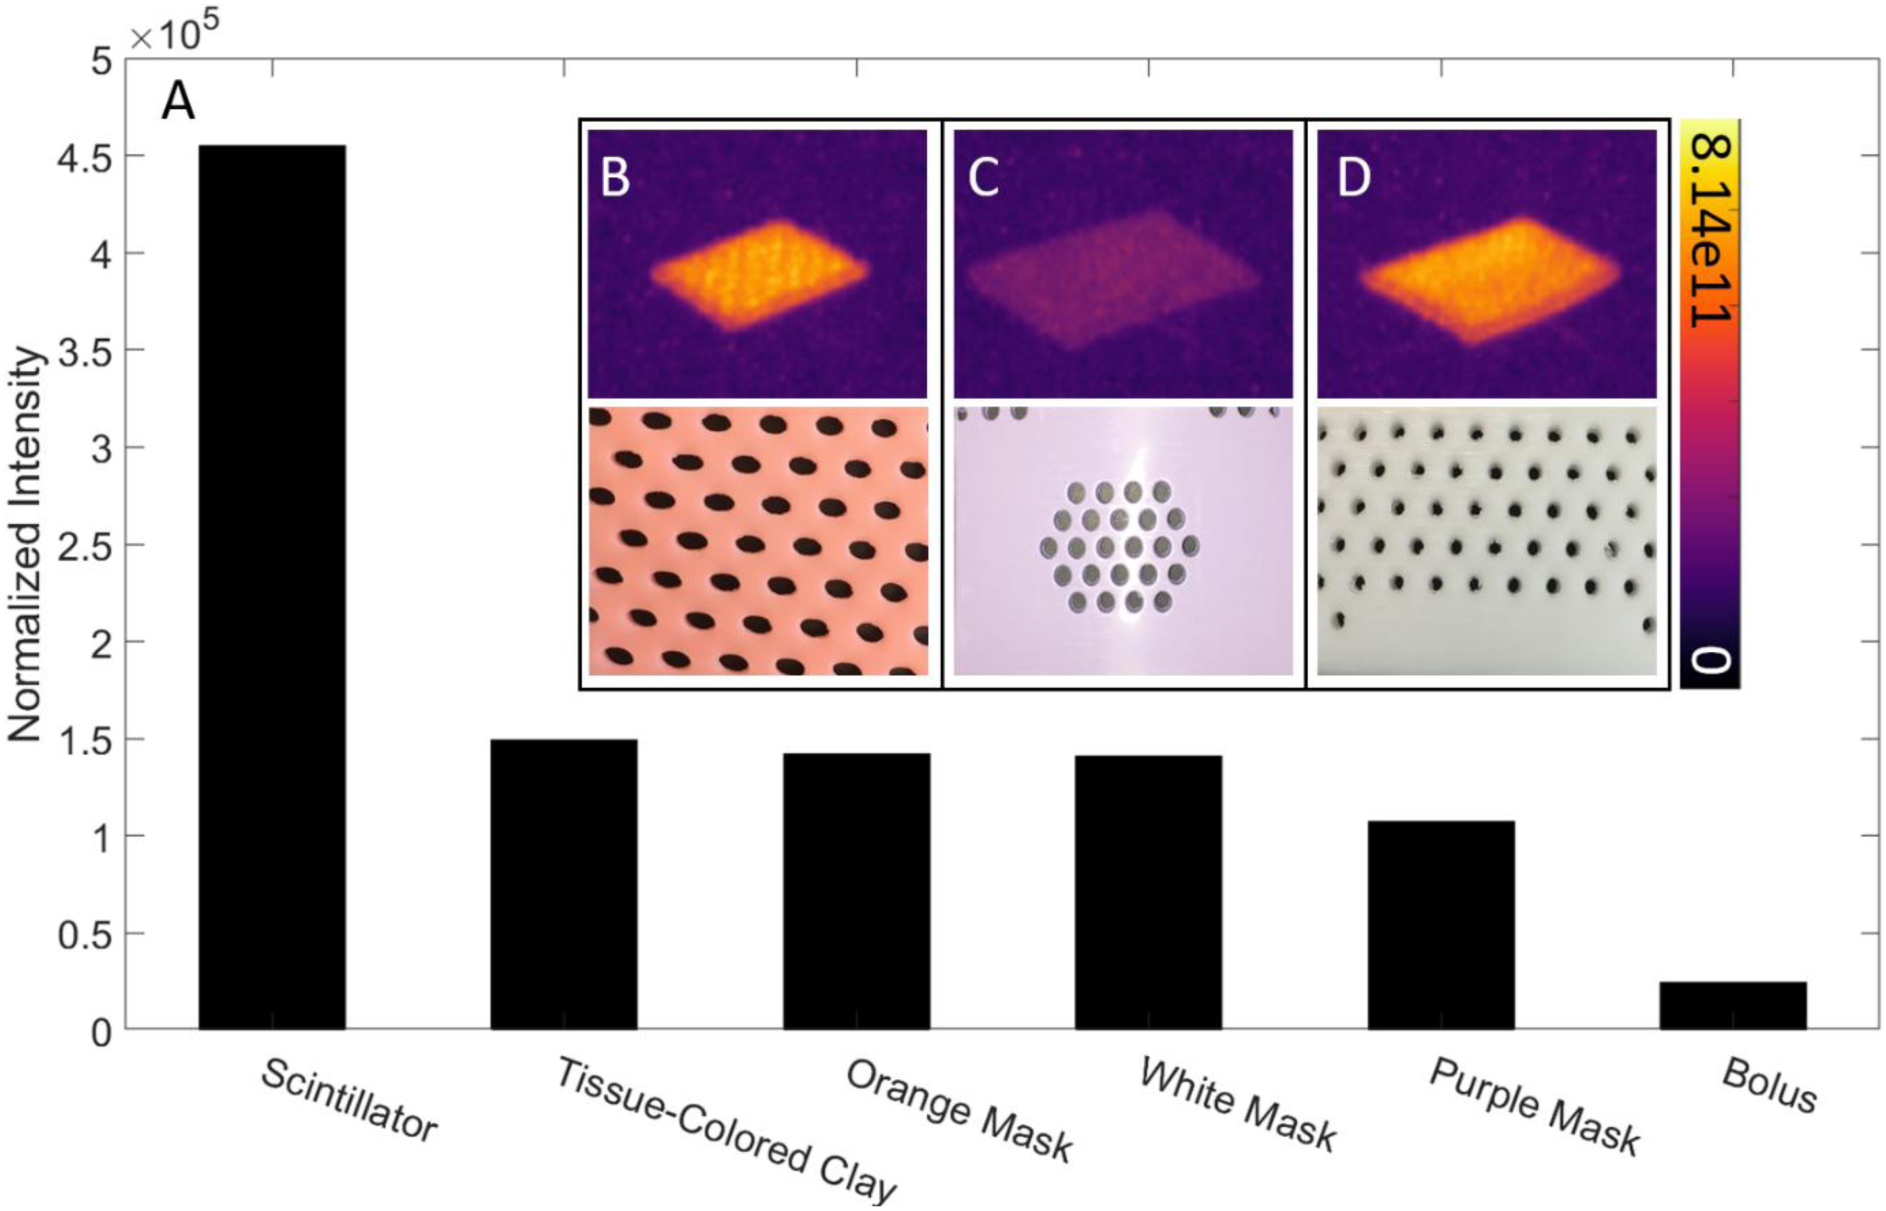
Figure 3:

Relative intensity and SNR values for scintillator, tissue-colored clay, transparent bolus, and mask samples. Luminescence images and photographs of orange (B), purple (C), and white (D) thermoplastic mask samples. Colorbar is presented in photons cm−2 sr−1 s−1.
