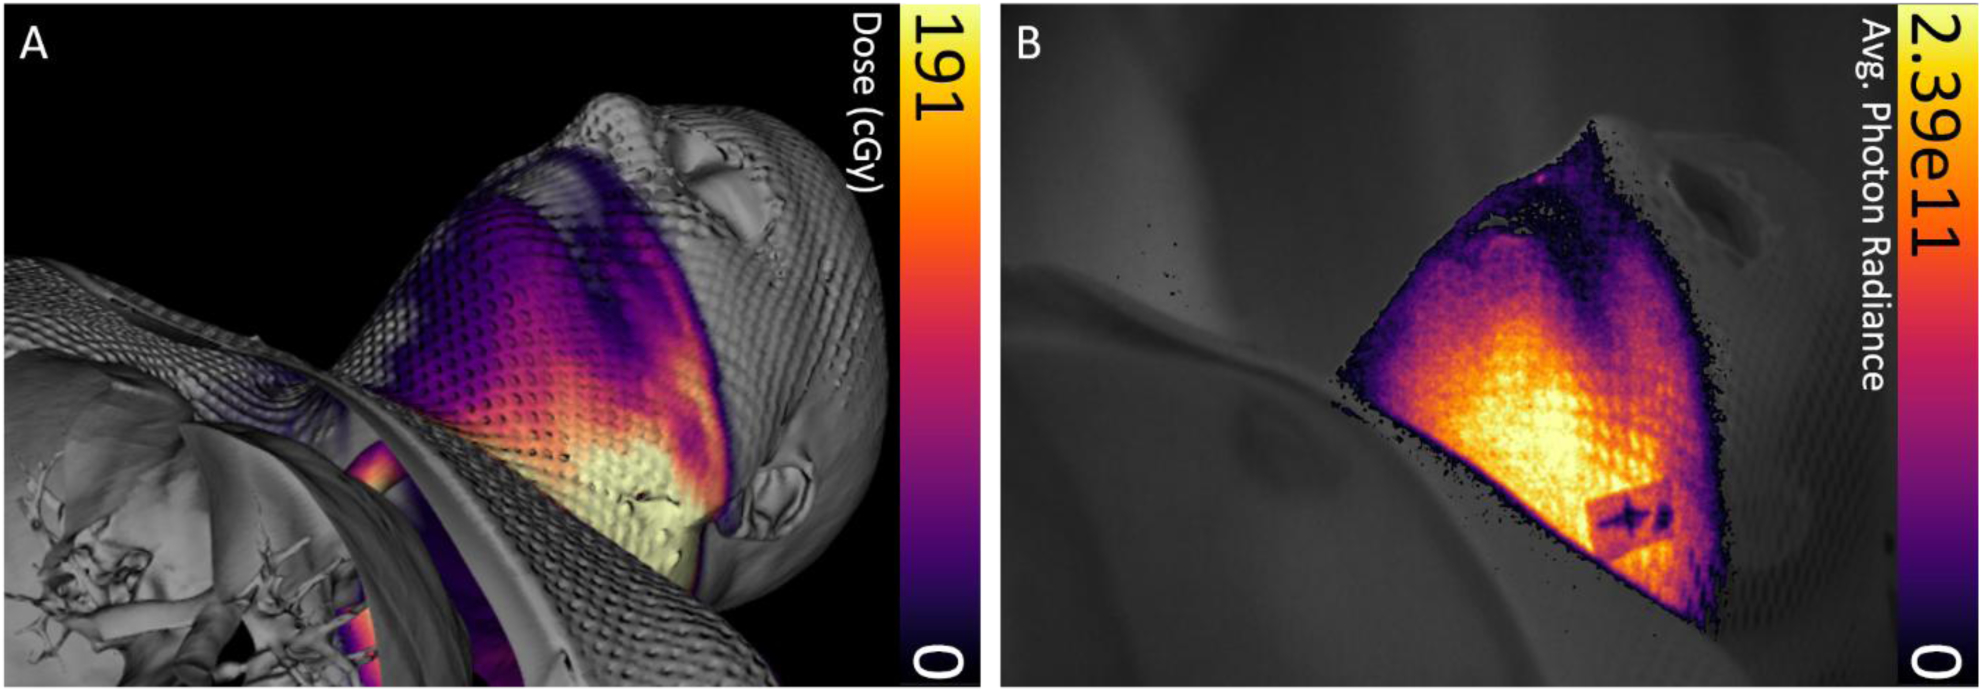
Figure 6:

Coregistered intensity maps from patient treatment plan and treatment delivery. (A) Dose distribution overlaid with 3D simulation CT data from the patient treatment plan. (B) Cumulative Cherenkov intensity distribution captured through the immobilization mask acquired real-time during treatment. Colorbar is presented in photons cm−2 sr−1 s−1.
