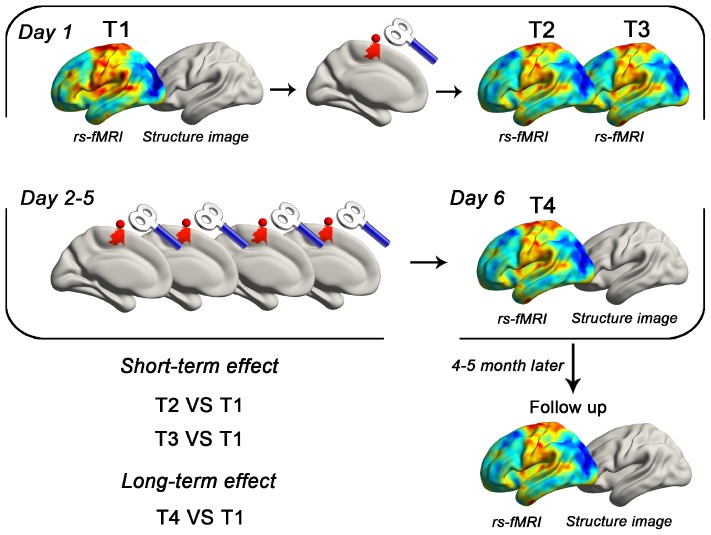
FIGURE 1.
Schematic of the primary experiment. Using a between-subject design, each subject received real or sham cTBS for 5 consecutive days. The target area was defined as the superficial central point (MNI coordinates: −6, −6, 77; radius = 6 mm) of the left SMA proper in the Automated Anatomical Labeling template. RS-fMRI data were collected in five time points (T1, T2, T3, T4, and follow-up). T1 images were also obtained in the first and sixth day.

