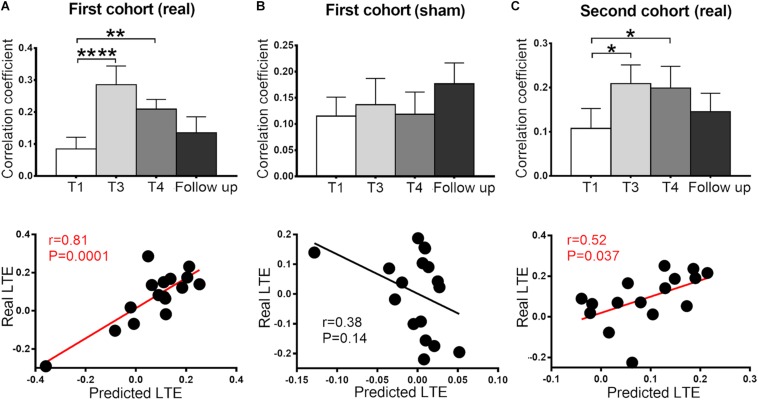
FIGURE 3.
Functional connectivity between SMA and ParaCG at four time points (T1, T3, T4, and follow-up) and cross-time prediction in the two cohorts. In the primary cohort, the connectivity significantly increased at T3 and T4 in the real (A) but not sham (B) group. This alteration was reproduced in the second cohort (C). No significant difference was found between the baseline and follow-up in all three groups. The predicted LTE was positively correlated with the real values in real groups (A,C), but not sham group (B). Error bars indicate SEM. *P < 0.05, **P < 0.01, and ****P < 0.0001. None of the values were outliers that exceeded three standard deviations of the mean.

