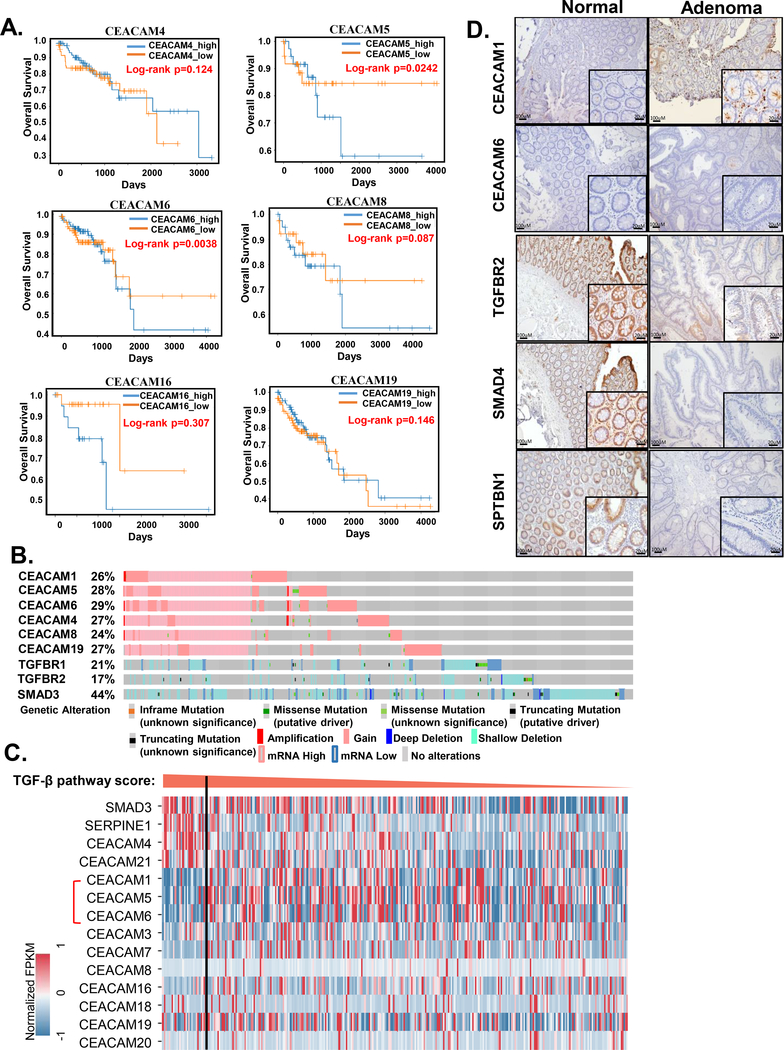
Figure 2.
CEACAMs and TGFB signaling pathway in human CRC. A) Kaplan–Meier survival plots of patients stratified according to expression of the indicated CEACAM family members. The p-values were calculated by log-rank test. B) OncoPrints of genomic alterations of the indicated genes from CRC data of cBioportal. C) Expression of CEACAM genes in COAD cases sorted according to TGFB signaling activity as indicated by SMAD3 (TGFB signaling mediator) and SERPINE1 (TGFB target gene) expression. The TGFB pathway activity score threshold is set to top 10% as indicated by the vertical line. D) Representative immunohistochemical data for human colon adenoma samples stained for CEACAM1, CEACAM6, TGFBR2, SMAD4, and SPTBN1.

