
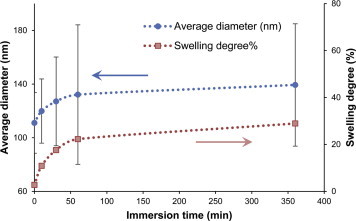
Figure 5.
Diameter and swelling degree of fibers with different water immersion times. Error bars are the standard deviation of fibers found on three different images.
Official websites use .gov
A
.gov website belongs to an official
government organization in the United States.
Secure .gov websites use HTTPS
A lock (
) or https:// means you've safely
connected to the .gov website. Share sensitive
information only on official, secure websites.
Diameter and swelling degree of fibers with different water immersion times. Error bars are the standard deviation of fibers found on three different images.