
Fig. 1.
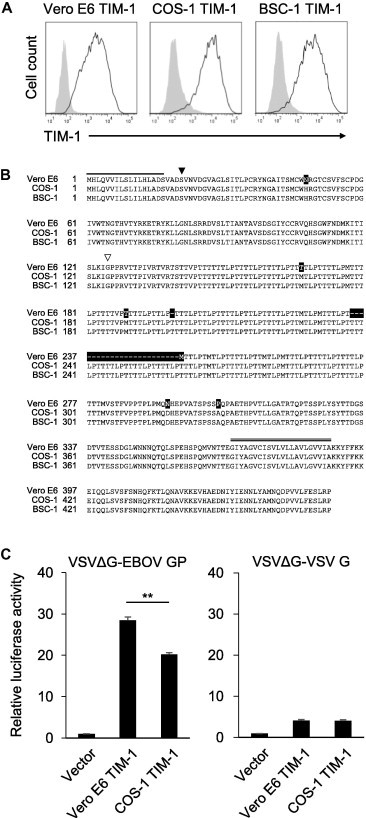
Characterization of TIM-1s derived from three different African green monkey kidney cell lines. (A) 293T cells stably expressing TIM-1s derived from three African green monkey kidney cell lines (Vero E6, COS-1, and BSC-1 cells) were stained with an anti-TIM-1 polyclonal antibody and analyzed by flow cytometry. Open and shaded histograms indicate the fluorescent intensities of the indicated transfectant and vector-transduced control cells, respectively. (B) The deduced amino acid sequences were aligned using GENETYX (version 10). Numbers of residues starting with the respective initiating methionine codons are shown [35]. The signal peptide and transmembrane region are indicated with single and double lines above the Vero E6 TIM-1 sequence, respectively. Black and white arrows indicate the beginning of the IgV domain and mucin domain, respectively. Gaps introduced in the sequences for the alignment are indicated by dashes. Black shading indicates non-identical amino acid residues among TIM-1s. (C) 293T cells expressing TIM-1s and control cells were infected with VSVΔG-EBOV GP or VSVΔG-G at a MOI of 0.02-0.04. Luciferase activities were measured 24 h postinfection. The means of three independent experiments are shown. Error bars represent standard deviations (SDs). Significance was calculated using student’s t-test (∗∗P < 0.01).