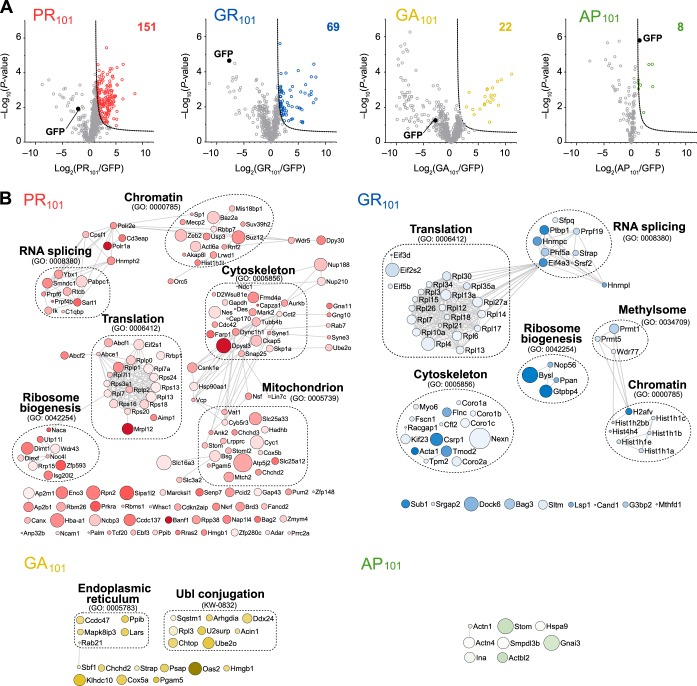
Fig. 2.
Interactome analysis of the DPR101 variants. A, Volcano plots of each DPR101-GFP versus GFP-only control from quantitative proteomic analysis of GFP-Trap immunoprecipitates of DPR101-GFP transfected in Neuro2a cells harvested 48h after transfection. Significant binders (shown in colored circles) were classified with False Discovery Rate of ≤ 0.01 (dotted lines). The number of interactors is indicated. n = 4 biological replicates for PR and AP and n = 3 biological replicates for GR and GA. B, STRING (v10) interaction maps for proteins significantly enriched with confidence set at 0.9 (highest stringency). Circle sizes are proportional to −log10 (p value). The color intensity is proportional to the log2 (fold change). Selected significantly enriched GO terms (GOCC, GOPB, and UniProt keywords) are displayed.

