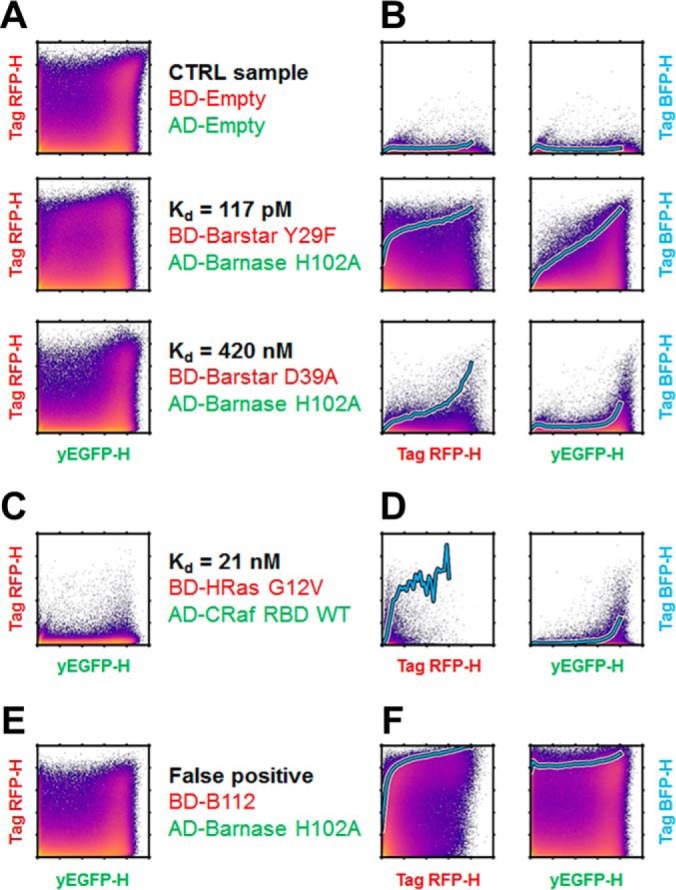
Fig. 2.

Single-cell raw data from the flow-cytometry acquisition. A–F, Fluorescence intensities in the channels corresponding to the BD-Bait (Tag-RFP-H), AD-Prey (yEGFP-H) and reporter (Tag-BFB-H) are represented as density-colored scatter plots for a subset of studied couples. Intensities were pre-processed by a hlog-transformation. The expression of the BD-Bait as a function of AD-Prey is presented in A, C, and E, The expression level of the reporter as function of the BD-Bait or AD-Prey is displayed in B, D, and F, The cyan bold line represents the evolution of the Tag-BFP-H intensity when averaged over the 5% top-ranked cells in slices of the yEGFP-H or Tag-RFP-H channel. In addition to the CTRL sample, a strong (picomolar) and a medium (nanomolar) couple are shown, see A and B. As an example for low expression, the construct BD-Bait HRas is shown in C and D. We also constructed a genetic fusion of the LexA BD with the B112 AD as an example of a false positive interaction, see E and F.
