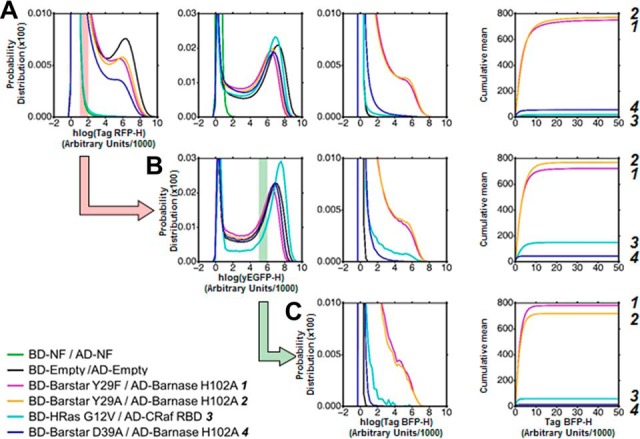
Fig. 4.

Influence of the expression level of BD-Bait and AD-Prey on the reporter level. A–C, The expression levels of BD-Bait (1st column), AD-Prey (2nd) and reporter (3rd) are visualized as a probability distribution of the hlog-transformed fluorescence intensities. In order to better visualize differences in the reporter expression we use an additional representation of the cumulative mean in linear scale (4th column). The distributions and cumulative mean are shown for the global population in A and gated subpopulations in B and C. For reasons of clarity, only an illustrative subset of studied couples is shown. In the legend these couples are ordered and numbered (1-4) according to their in vitro affinity. The order of the couples according to the reporter expression (i.e. mean value of the Tag-BFP-H channel) is given on the very right side of the three subfigures. The global population of cells reveals significant differences in the expression levels of BD-Bait and to a smaller extent of AD-Prey A. Because of these expression level differences, the mean values of Tag-BFP-H are ordered differently than the in vitro affinities: 2 displays a stronger reporter expression than 1, and 4 stronger than 3. Only the discrimination between strong (1, 2) and medium (3, 4) interactors is possible. The successive gating of cells, first based on Tag-RFP-H (700 < Tag-RFP-H < 900) values (B), and then based on yEGFP-H (5000 < yEGFP-H < 6000) values (C), allows to equalize the expression levels. Such standardized subpopulations improve the extraction of quantitative information on the strength of the Bait-Prey interactions: the Tag-BFP-H mean value is ordered according to the in vitro affinities. The transparent red bar in the panel of the 1st column shows the Tag-RFP-H gating interval applied to obtain the subpopulation in B (symbolized by the red action arrow). Similarly, the green bar and arrow illustrate the yEGFP-H gating interval applied to the subpopulation in B to obtain the final subpopulation in C.
