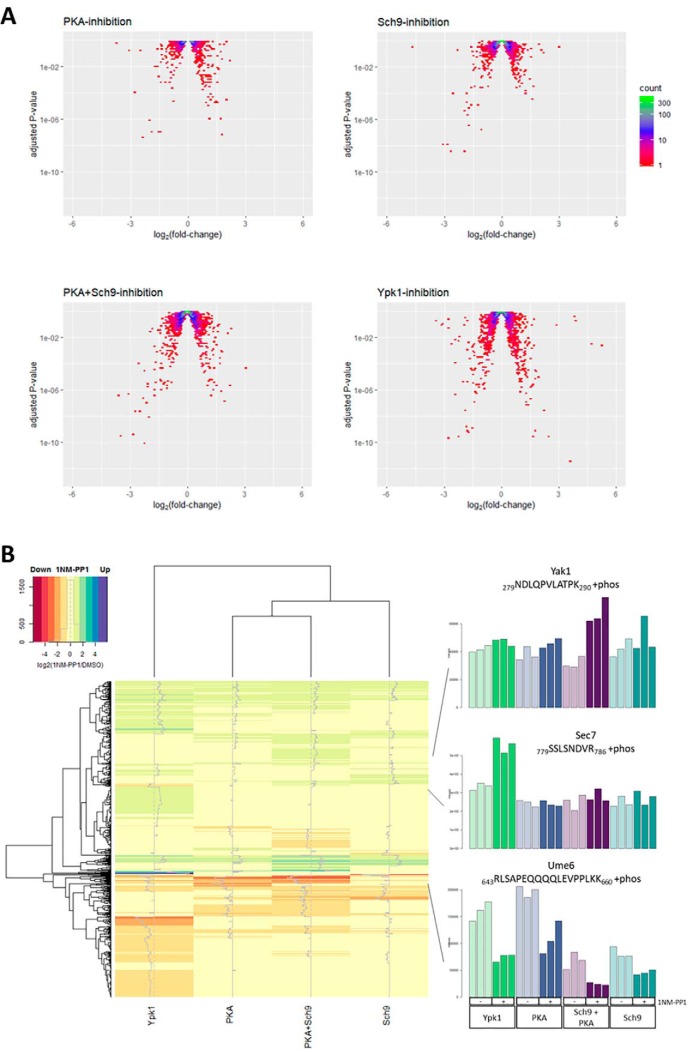
Fig. 2.
Phosphorylation changes upon AGC-kinase inhibition. A, Volcano-plots depicting log2-fold-changes (mean of three replicates) versus adjusted p values for intensities of all quantified phospho-peptides in 1NM-PP1 versus DMSO treated samples. Density is color-coded according to legend. B, Heatmap depicting mean values for three replicates of log2-fold changes in phospho-peptide intensities for 1NM-PP1 versus DMSO treated samples. Data of phospho-peptides significantly (pAdj < 0.05) hyper- or hypo-phosphorylated upon inhibition of at least one kinase in the PKA+Sch9, PKA, Sch9 or Ypk1 data set are shown. Bargraphs of normalized intensities for three selected phospho-peptides are shown to the right.

