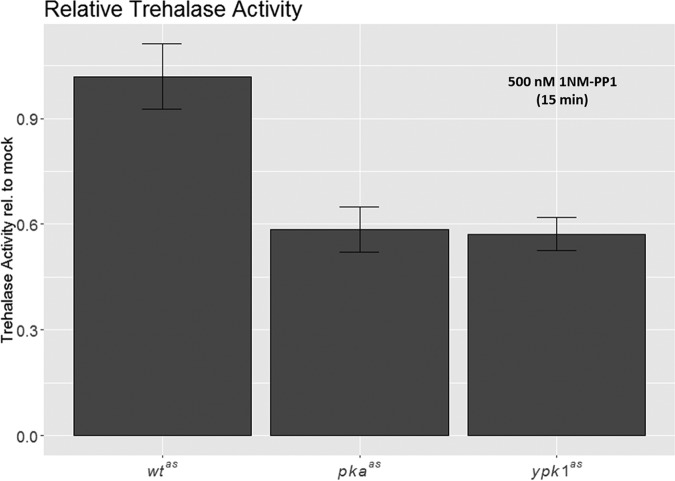
Fig. 8.
Inhibition of PKA and Ypk1 leads to reduced Nth1 activity. Barplot depicting trehalase activity of 1NM-PP1 treated wtas, pkaas and ypkas strains relative to activity of corresponding DMSO-treated strains. Strains were in exponential growth phase and treatment was for 15 min. Error-bars depict standard deviation of six replicates. Reduction of relative trehalase acitivity in pkaas and ypk1as strains is significant with p = 6 × 10⁻⁶ and p = 1 × 10⁻⁵ respectively.

