Fig. 6.
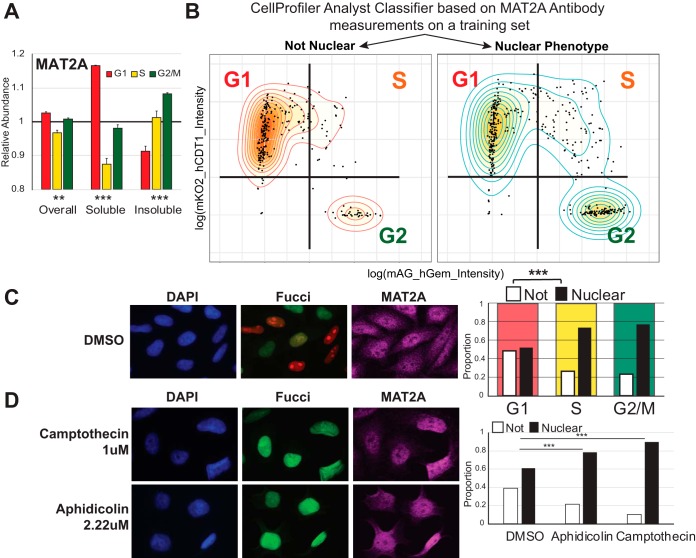
MAT2A Use Nuclear Translocation for Localized Cell-Cycle Dependent Functions. A, Bar graph of MAT2A protein abundance pattern. Significance denotes identifying the pattern to be oscillating. B–C, Immunofluorescence-based classification of nuclear and non-nuclear MAT2A localizations corresponds to cell cycle phase according to Fucci categorization. Nuclear localization was determined using a machine learning classifier using a separate training set. D, Arrest in replication leads to an accumulation of nuclear MAT2A phenotype. **: p < 0.01, ***: p < 0.001.

