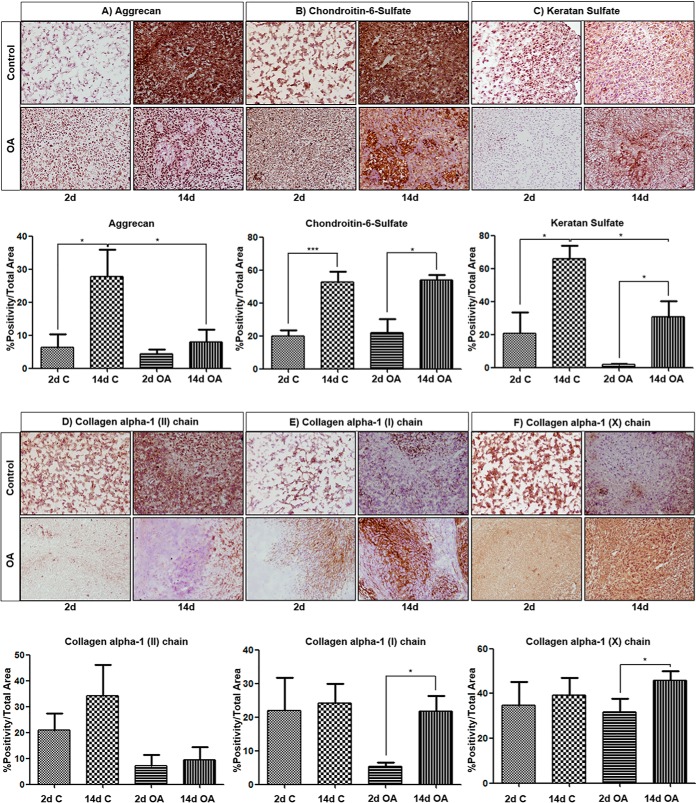
Fig. 1.
Chondrogenic differentiation of control and OA hBMSCs. A, Immunodetection of aggrecan, B, chondroitin-6-sulfate, C, keratan sulfate, D, collagen alpha-1 (II) chain, E, collagen alpha-1 (I) chain and F, collagen alpha-1 (X) chain, assessed on control and OA micromasses after 2 and 14 days of chondrogenesis. Representative images of the inmunoanalysis (normal, n = 4; OA, n = 5) are shown in the panels (magnification x20). In (A–F), quantitative analysis data are presented as mean percentage positivity/total micromass area ± SEM. *p value <0.05, **p value <0.01, ***p value <0.001 (Mann Whitney test). C, control; OA, osteoarthritis; 2d, 2 days; 14d, 14 days.

