Fig. 4.
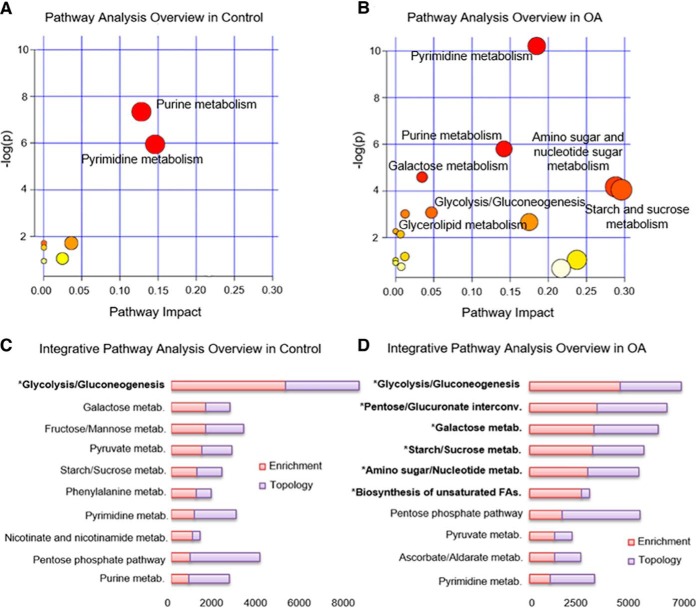
Metabolic and integrative pathway analysis overview observed in hBMSCs during chondrogenesis. A, B, Metabolic pathways significantly altered in control (A) and OA (B) hBMSCs between day 2 and day 14 of chondrogenesis. C, D, Top 10 altered pathways observed by integrative pathway analysis for control (C) and OA (D) hBMSCs during chondrogenesis. All the matched pathways identified based on overrepresentation analysis (ORA) are visualized by circles, with the circle size indicating pathway impact (arbitrary scale). The color of the circles indicates unadjusted p values (y axis) from pathway enrichment analysis, with red < 0.003; orange < 0.2, and yellow < 0.4 for panel A and, red < 0.02; orange < 0.1, and yellow < 0.5 for panel B. The x axis represents increasing metabolic pathway impact according to the degree of centrality from topology analysis. Terms highlighted with an asterisk were significantly altered (p value < 0.05).

